
Indicators provided are sales, median prices, inventory indicators, and so much more!
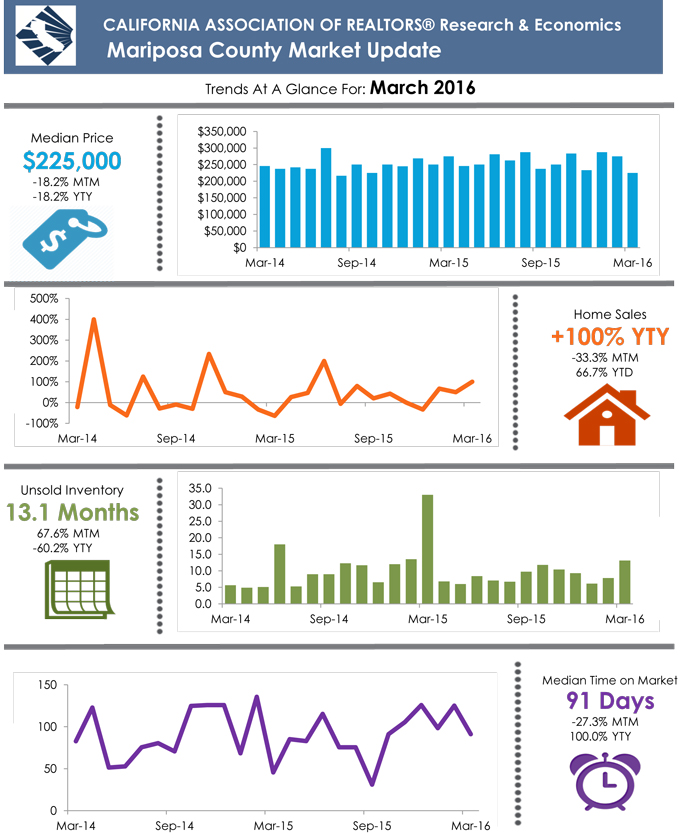
Note: “Unsold Inventory Index” represents the number of months it would take to sell the remaining inventory for the month in question. The remaining inventory for the month is defined as the number of properties that were “Active”, “Pending”, and “Contingent” (when available) and divide the sum by the number of “Sold” properties for the month in question.
Source: California Association of Realtors.