
California pending home sales register higher in August but affordability and supply constraints remain concerns
September 23, 2016 - LOS ANGELES – An increase in pending sales across all major regions buoyed statewide California pending home sales in August from a year ago, the CALIFORNIA ASSOCIATION OF REALTORS® (C.A.R.) said yesterday.
Uncertainty about market conditions was reflected in C.A.R.’s August Market Pulse Survey,** with most leading indicators showing a decline in growth and REALTORS® becoming less optimistic about market expectations and more concerned with reduced affordability.
Pending home sales data:
• Statewide pending home sales rose in August on a seasonally adjusted annualized basis, with the Pending Home Sales Index (PHSI)* increasing 6.4 percent from 113.9 in August 2015 to 121.3 in August 2016, based on signed contracts. The year-over-year increase was the fifth consecutive positive annual improvement and the largest in 2016. Despite the improvement, overall market conditions appear to be slowing down and closed transactions plateauing.
• On a month-to-month basis, California pending home sales slipped 1.0 percent from July’s index of 122.5 – the fourth consecutive decline, which was largely due to seasonality. The monthly decrease was the smallest July-to-August decline in four years, suggesting that sales may remain at similar current levels.
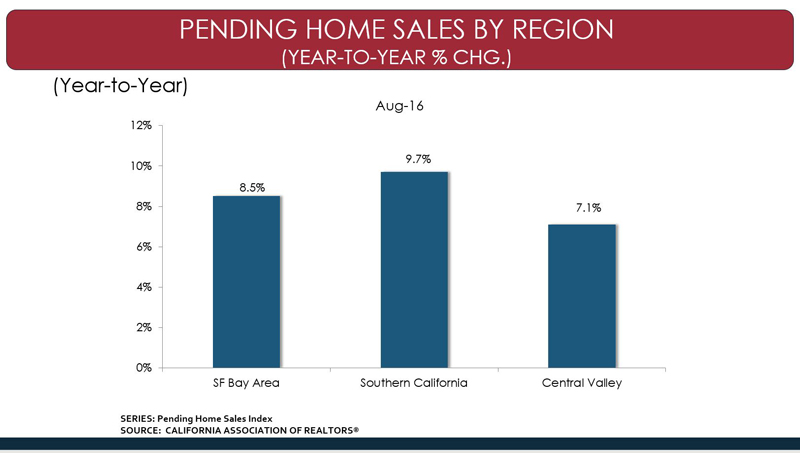
• All major regions posted solid year-over-year increases in pending home sales, led by Southern California, which posted the largest gain, followed by the San Francisco Bay Area and the Central Valley.
• Pending home sales in Southern California as a whole rose 9.7 percent from August 2015, thanks primarily to year-over-year pending sales increases of 15.5 percent in San Diego, 7.4 percent in Los Angeles County, and 3.0 percent in Orange County. Compared to July 2016, pending home sales were down 7.2 percent.
• For the Bay Area as a whole, pending sales rose 8.5 percent from August 2015 and 4.1 percent from July. A strong 14.8 percent increase in pending sales in Santa Clara County drove the improvement in the Bay Area, as well as double-digit pending sales gains in San Francisco (10.4 percent) and San Mateo (11.9 percent) counties.
• Overall pending sales in the Central Valley also performed well, posting a 7.1 percent annual increase and a 2.3 percent month-over-month gain. One exception for the region was Kern County, where pending sales have been dropping significantly due to a decline in oil prices and the economy’s reliance on the energy sector.
Year-to-Year Change in Pending Sales by County/Region
| County/Region/State | Aug-16 | Aug-15 | Yearly % Change |
| Counties | |||
| Kern | 82.9 | 94.3 | -12.1% |
| Los Angeles | 90.0 | 83.7 | 7.4% |
| Monterey | 67.9 | 74.6 | -9.0% |
| Orange | 73.3 | 71.2 | 3.0% |
| Sacramento | 80.7 | 75.3 | 7.2% |
| San Bernardino | 76.2 | 72.4 | 5.1% |
| San Diego | 148.8 | 128.9 | 15.5% |
| San Francisco | 88.4 | 80.1 | 10.4% |
| San Mateo | 100.4 | 89.7 | 11.9% |
| Santa Clara | 101.0 | 87.9 | 14.8% |
| Regions | |||
| SF Bay Area | 149.2 | 137.5 | 8.5% |
| So. CA | 103.4 | 94.3 | 9.7% |
| Central Valley | 105.2 | 98.3 | 7.1% |
| California* (SA) | 121.3 | 113.9 | 6.4% |
August REALTOR® Market Pulse Survey**:
In a separate study, California REALTORS® responding to C.A.R.’s August Market Pulse Survey reported a decline in floor calls, listing appointments, and open house traffic, which was expected as seasonal factors typically lead to fewer market activities at this time of year.
• After reaching an all-time high of 38 percent in May, the share of homes selling above asking price dropped to 29 percent in August, up from 27 percent a year ago. The share of properties selling below asking price dropped to 41 percent from 48 percent in August 2015. The remaining 30 percent sold at asking price, up from 25 percent in August 2015.
• For homes that sold above asking price, the premium paid over asking price rose to 10 percent, up from 7.8 percent in July and 8.2 percent from a year ago.
• The 41 percent of homes that sold below asking price sold for an average of 12 percent below asking price in August, which was down from 14 percent in July and up from 11 percent a year ago.
• More than six in 10 of properties (62 percent) for sale received multiple offers in August, down from 66 percent in July and up from 58 percent in August 2015.
• The average number of offers per property remained at 2.8 in August, unchanged from July and up from 2.4 in August 2015. The year-over-year increase is likely due to a greater proportion of properties that received three or more offers – from 32 percent a year ago to 42 percent in August. Homes priced between $200,000 - $299,000 saw the most significant increase in three or more offers compared to a year ago, primarily due to their better affordability.
• In a sign slowing market activity, nearly a third (31 percent) of properties had listing price reductions in August, up from 26 percent in July and 30 percent from August 2015.
• Declining housing affordability topped lack of inventory as REALTORS®’ number one concern for the first time in nearly a year, with 26 percent stating they were concerned about low housing affordability, and 19 percent indicating they were concerned about a tight housing supply. REALTORS® also were concerned about inflated home prices/housing bubble, a slowdown in economic growth, lending and financing, rising interest rates, and policy and regulations.
• REALTORS® were the least optimistic in August since C.A.R. began tracking this data in January 2014. REALTORS®’ optimism of market conditions over the next year has been waning for the past few months and is now barely in positive territory at an index of 51, down from 52 in July and 58 in August 2015.
Graphics (click links to open):
• YTY change in pending home sales by region.
• More properties selling below asking price.
• Two-thirds of homes received multiple offers.
• Price range of homes receiving 3+ offers.
• Affordability tops REALTORS®’ concerns.
*Note: C.A.R.’s pending sales information is generated from a survey of more than 70 associations of REALTORS® and MLSs throughout the state. Pending home sales are forward-looking indicators of future home sales activity, offering solid information on future changes in the direction of the market. A sale is listed as pending after a seller has accepted a sales contract on a property. The majority of pending home sales usually becomes closed sales transactions one to two months later. The year 2008 was used as the benchmark for the Pending Homes Sales Index. An index of 100 is equal to the average level of contract activity during 2008.
**C.A.R.’s Market Pulse Survey is a monthly online survey sent to more than 10,000 California REALTORS® to measure data about their last closed transaction and sentiment about business activity in their market area for the previous month. Approximately 300 REALTORS® responded.
Leading the way...® in California real estate for more than 110 years, the CALIFORNIA ASSOCIATION OF REALTORS® (www.car.org) is one of the largest state trade organizations in the United States with 185,000 members dedicated to the advancement of professionalism in real estate. C.A.R. is headquartered in Los Angeles.
Source: C.A.R.