


Outside of the Diltz Mine in the Sherlock Mining District in Mariposa County
Sierra Sun Times file photo
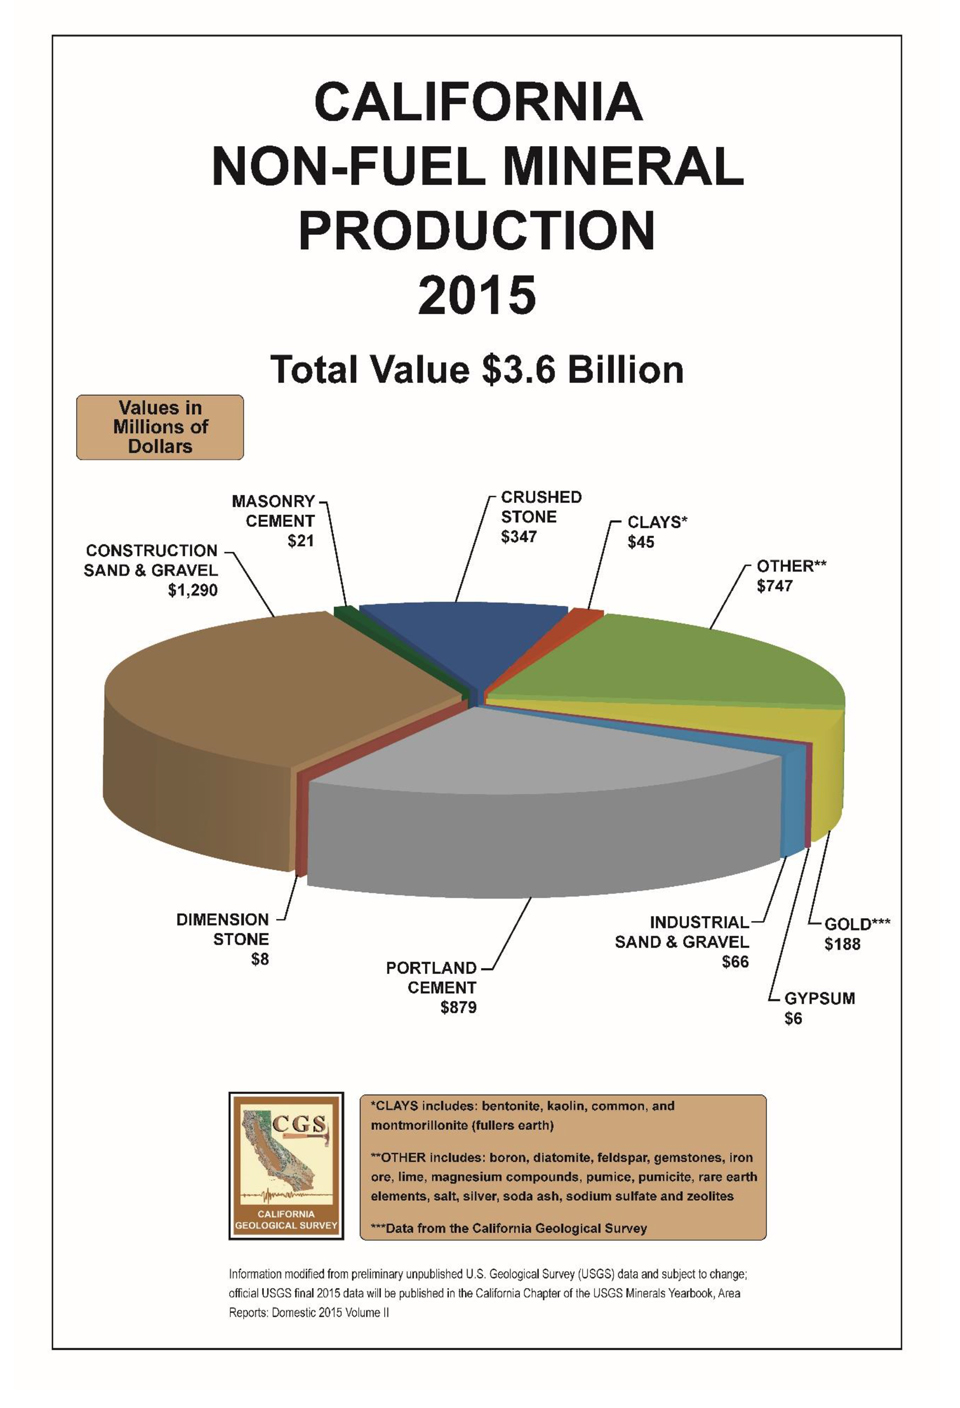
August 6, 2017 - The California Geological Survey has released a new report: California’s Non-Fuel Mineral Production in 2015. California ranked sixth among the states in non-fuel mineral production, accounting for approximately 4.2 % of the United States total. There were 717 active mines in the state and the total market value of production was $3.6 billion.
CALIFORNIA NON-FUEL MINERALS 2015
By John Clinkenbeard, Supervising Engineering Geologist (PG #4731) California Geological Survey
Based on U.S. Geological Survey (USGS) preliminary data for 2015, California ranked sixth after Nevada, Arizona, Texas, Minnesota, and Wisconsin in the value of non-fuel mineral production, accounting for approximately 4.2 percent of the nation’s total. The market value of non-fuel mineral production for California was $3.6 billion. California produced more than two dozen non-fuel mineral commodities during the year, and was the only U.S. producer of boron compounds and rare earth elements. It led the nation in the production of construction sand and gravel and diatomite, and was second behind Texas in portland cement production. The state ranked fourth out of eleven states that reported gold production for the year. Other mineral commodities produced include bentonite clay (including hectorite), common clay, crushed stone, dimension stone, feldspar, fuller's earth, gemstones, gypsum, industrial sand and gravel, iron ore, kaolin clay, lime, magnesium compounds, masonry cement, pumice, pumicite, salt, silver, soda ash, sodium sulfate, and zeolites.
There were 717 active mines in California producing non-fuel minerals during 2015 (California Office of Mine Reclamation). Approximately 5,400 people were employed at these mines and their processing facilities (California Employment Development Department, Labor Market Information Division).
INDUSTRIAL MINERALS
Construction-grade sand and gravel was California’s leading mineral commodity in terms of dollar value in 2015. California produced 107 million tons of construction sand and gravel worth $1.29 billion in 2015; in 2014, the state produced 96 million tons valued at $1.01 billion. Portland cement ranked second in value at $879 million for 10.9 million tons produced, an increase in value and tonnage over 2014. Boron minerals ranked third in value; because there are only two producers of boron minerals in the state, specific production values are withheld to protect proprietary company information. The value of boron production is included in the “other” category in the table and chart. Crushed stone ranked fourth with a value of $347 million for 41.9 million tons produced, an increase over the revised 2014 value and production.
Construction materials, including aggregate (sand and gravel and crushed stone) and cement, accounted for about 70 percent of the value of California’s annual non-fuel mineral production in 2015. The building and paving industries consume large quantities of construction materials, which are essential to the state, to maintain the existing infrastructure and to provide for new construction.
Aggregate
Total production of construction aggregate (sand and gravel and crushed stone) in 2015 was 148.9 million tons valued at $1.64 billion. This compares to the revised 2014 production of 135.5 million tons valued at $1.32 billion. The average statewide production of construction aggregate over the last 30 years (1986-2015) has been about 179 million tons per year.
In December 2014, the Solano County Planning Commission approved the use permit and reclamation plan for the proposed expansion of the Syar Industries Lake Herman Quarry. The expansion will increase both the acreage and the depth of the existing quarry (not reported in the 2014 report).
In February of 2015, the San Luis Obispo County Planning Commission denied the Conditional Use Permit for the proposed Las Pilitas Quarry project. In May, the San Luis Obispo County Board of Supervisors upheld the Planning Commission decision. The proposed quarry would have produced up to 500,000 tons of construction aggregate per year for a period of approximately 30 years.
In February, the Fresno County Planning Commission approved the proposed Riverbend Sand and Gravel project near Sanger. The mine will produce up to 1.25 million tons of construction aggregate a year for 75 years.
In November, the Napa County Planning Commission approved the expansion of the Syar Industries Napa Quarry. The expansion will increase annual production from approximately 1 million to 1.3 million tons and extend the quarry life for 35 years.
Cement
Portland cement production was 10.9 million tons valued at $879 million in 2015, ranking second in value among commodities produced in the state. This is a slight increase over the revised 2014 production of 10.8 million tons valued at $829 million.
Rare Earth Elements
In June of 2015, Molycorp Minerals LLC., operator of the Mountain Pass Mine in San Bernardino County, filed for Chapter 11 bankruptcy. The company announced in August that the mine and processing facility would be placed on care and maintenance in October. The Mountain Pass Mine was the only domestic producer of Rare Earth Elements (REE).
METALS
Gold dominated California’s metal production in 2015 – comprising over 99 percent of the value of the state’s metals production. Gold production increased slightly to 160,767 ounces in 2015, from a 2014 production of 144,123 ounces. The value of gold production in the state increased to $187.5 million from $183.3 million in 2014.
The state’s largest gold producer was the New Gold Inc. Mesquite Mine in Imperial County. It produced approximately 134,868 ounces for the year.
In November, Atna Resources Ltd., operator of the Briggs Mine in Inyo County, filed for Chapter 11 bankruptcy. Mining and crushing operations at the Briggs Mine were discontinued in the third quarter of the year.
Golden Queen Mining Company Ltd. continued construction of its Soledad Mountain project located approximately five miles south of Mojave in Kern County. Stockpiling of unprocessed ore started in late August. The open pit mine will use a cyanide heap leach and a Merrill-Crowe process to recover gold and silver. The company anticipates first gold production in 2016.
In addition to the above mentioned lode mines, placer gold was produced as a byproduct from many sand and gravel mines in the northern and central parts of the state. California also has several small lode mines that sporadically produce gold, including specimen gold and gold in quartz for use in jewelry.
Silver is produced as a byproduct of gold production and makes up less than two tenths of one percent of California’s total metal production by value. Silver production decreased slightly in 2015 compared to revised 2014 production.
A small amount of iron ore was produced in 2015. Much of the iron ore currently produced in California is used in the production of portland cement and is considered an industrial mineral.
REVISIONS TO 2014 DATA
Based on revised USGS data for 2014, the 2014 market value of non-fuel minerals decreased from $3.55 to $3.16 billion. The revised 2014 data appears in the table.
THE CALIFORNIA GEOLOGICAL SURVEY
The California Geological Survey (CGS) Mineral Land Classification Project, a mandate of the Surface Mining and Reclamation Act (Public Resources Code Section 2710, et.seq.), continued to provide lead agencies with mineral resource maps that have proved to be of great value in land-use planning and mineral resource conservation. To date, CGS has completed mineral resource studies in about one third of the state. During the year, CGS assisted the State Mining and Geology Board with designation activities in the San Bernardino, Stockton-Lodi, San Luis Obispo-Santa Barbara, and North San Francisco Bay Production-Consumption regions. Mineral Land Classification updates are ongoing in the South San Francisco Bay and Western San Diego County regions.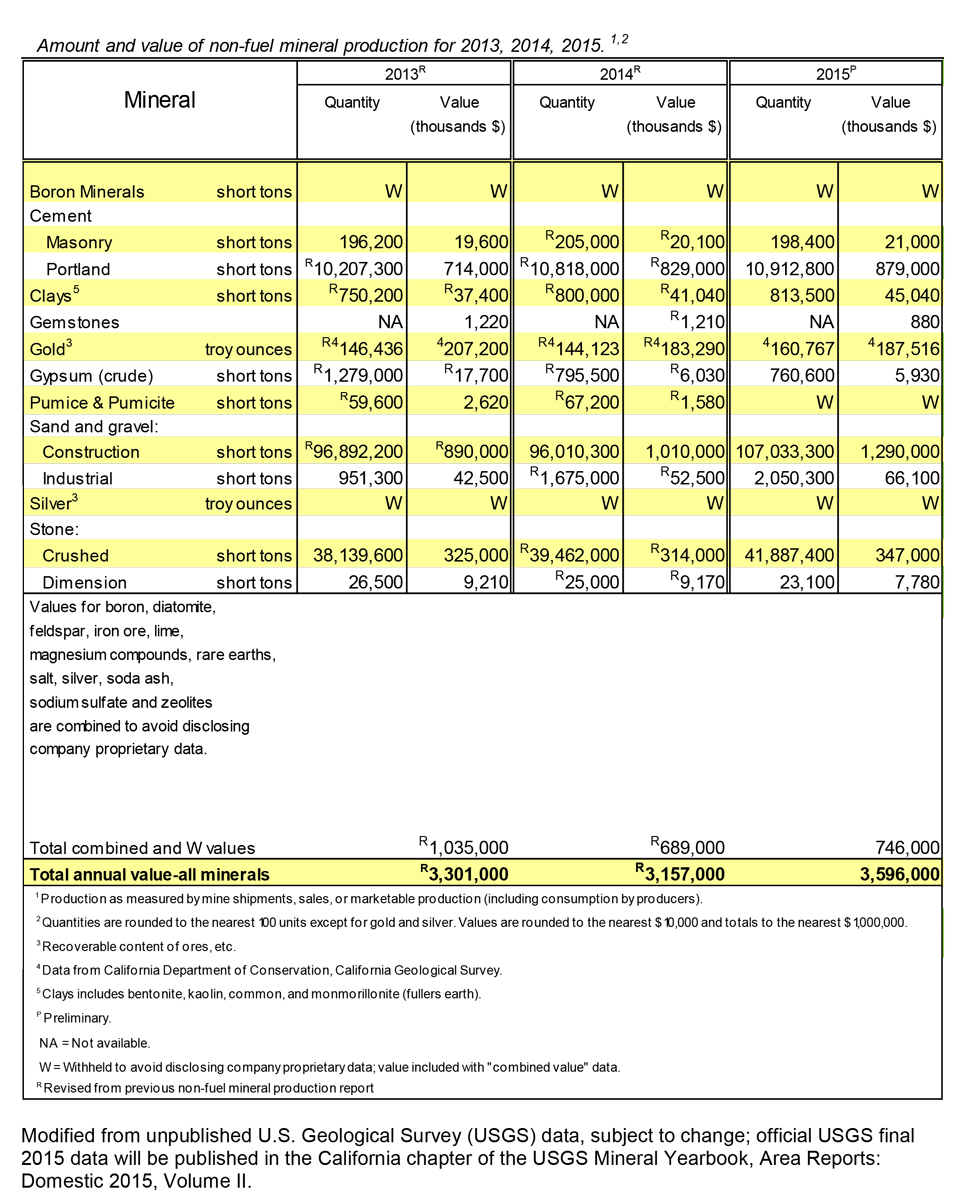
Source: State of CA.
California Geological Survey New Report on 2015 Non-Fuel Mineral Production Finds Gold Production at 160,767 Ounces
- Details

