


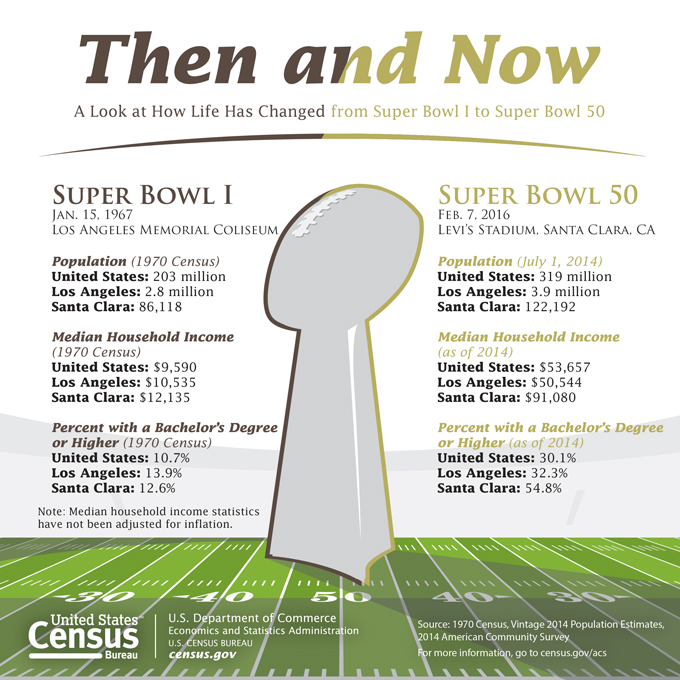
February 6, 2016 - Super Bowl 50 will be played Feb. 7 at Levi’s Stadium in Santa Clara, Calif. The first Super Bowl was played on Jan. 15, 1967, at Los Angeles Memorial Coliseum, with the Green Bay Packers beating the Kansas City Chiefs by the score of 35-10. This will be the second time the NFL’s championship game will be held in the San Francisco Bay Area. In the last one, the San Francisco 49ers beat the Miami Dolphins 38-16 at Stanford Stadium in 1985.
To commemorate this year’s golden anniversary Super Bowl, the Census Bureau has compiled a collection of facts looking at how life has changed from 1967 to 2016 and examining the demographics of the host metropolitan area, as well as the metro areas represented by the two participants — the Denver Broncos and the Carolina Panthers.
Go to <http://quickfacts.census.gov> for more statistics about the cities involved. Unless otherwise noted, all comparisons are statistically significant at the 0.10 level.
How Things Have Changed
U.S. Population
1967: 197.5 million2016: 322.8 million
Sources: Estimates of the Population of the United States by Age, Sex and Race: April 1, 1960, to July 1, 1973
<https://www.census.gov/prod/1/pop/p25-519.pdf>
Monthly Population Estimates for the United States: April 1, 2010, to December 1, 2016
<http://www.census.gov/popest/data/national/totals/2015/files/NA-EST2015-01.csv>
Population of Santa, Clara, Calif., site of Super Bowl 50
April 1, 1970: 86,118July 1, 2014: 122,192
Sources: 1970 Census
<http://www2.census.gov/prod2/decennial/documents/1970a_ca1-01.pdf>
U.S. Census Bureau, Vintage 2014 Population Estimates
<http://factfinder.census.gov/bkmk/table/1.0/en/PEP/2014/PEPANNRSIP.US12A>
World Population
1967: 3.5 billion2016: 7.3 billion
Source: Census Bureau, International Data Base
<http://www.census.gov/population/international/data/worldpop/table_population.php>
Median Sales Price of a New Single-Family Home
1967: $22,7002016: $282,800 (as of 2014)
Note: Sales prices shown are not adjusted for inflation or other factors.
Source: U.S. Census Bureau, Median and Average Sales Prices of New Homes Sold in United States: 1963-2015
<https://www.census.gov/construction/nrs/pdf/uspricemon.pdf>
Cost of a Gallon of Regular Gas
1967: 33 cents ($2.13 in 2015 dollars)2016: $1.86 (as of Jan. 25, 2016)
Source: U.S. Energy Information Administration, U.S. Gasoline and Diesel Retail Prices
<http://www.eia.gov/dnav/pet/pet_pri_gnd_dcus_nus_w.htm>
Price of Milk
1967: $1.03 gallon ($7.32 in 2015 dollars)2016: $3.31 gallon (as of 2015)
Source: Bureau of Labor Statistics, Consumer Price Index
<http://data.bls.gov/cgi-bin/surveymost?ap>
Cost of a First-Class Stamp
1967: 5 cents (36 cents in 2015 dollars)2016: 49 cents
Source: U.S. Postal Service
<https://www.usps.com/ship/first-class-mail.htm>
Median Age at First Marriage
1967: 23.1 men; 20.6 women2016: 29.2 men; 27.1 women (as of 2015)
Sources: U.S. Census Bureau
<http://www.census.gov/population/socdemo/hh-fam/ms2.pdf>
U.S. Census Bureau, 2014 American Community Survey
<http://factfinder.census.gov/bkmk/table/1.0/en/ACS/14_1YR/B12007>
Number of Foreign-Born People
1967: 9.6 million (as of 1970: They comprised 4.7 percent of the total population, and Italy was the leading country of origin.)2016: 42.4 million (as of 2014: They comprised 13.3 percent of the total population, and Mexico was the leading country of origin.)
Sources: Historical Census Statistics on the Foreign-Born Population of the United States: 1850 to 2000
<http://www.census.gov/population/www/documentation/twps0081/twps0081.pdf>
U.S. Census Bureau, 2014 American Community Survey
<http://factfinder.census.gov/bkmk/table/1.0/en/ACS/14_1YR/B05006>
Average Household Size
1967: 3.28 people2016: 2.54 people (as of 2015)
Source: U.S. Census Bureau, Current Population Survey (Households by Size: 1960 to Present)
<http://www.census.gov/hhes/families/data/households.html>
Number of People Age 65 and Older
1967: 19.1 million2016: 46.2 million (as of 2014)
Sources: Estimates of the Population of the United States by Age, Sex and Race: April 1, 1960, to July 1, 1973
<https://www.census.gov/prod/1/pop/p25-519.pdf >
U.S. Census Bureau, 2014 Population Estimates
<http://factfinder.census.gov/bkmk/table/1.0/en/PEP/2014/PEPAGESEX>
Median Age of the Population
1967: 28.12016: 37.7 (as of 2014)
Sources: Estimates of the Population of the United States by Age, Sex and Race: April 1, 1960, to July 1, 1973
<https://www.census.gov/prod/1/pop/p25-519.pdf >
U.S. Census Bureau, 2014 Population Estimates
<http://factfinder.census.gov/bkmk/table/1.0/en/PEP/2014/PEPAGESEX>
Life Expectancy at Birth
1967: 70.5 years2016: 78.8 years (as of 2013)
Sources: Historical Statistics of the United States: Colonial Times to 1970
<http://www2.census.gov/prod2/statcomp/documents/CT1970p1-03.pdf>
Centers for Disease Control and Prevention
<http://www.cdc.gov/nchs/fastats/life-expectancy.htm>
Percentage of Women in the Labor Force, Age 16 and Older
1967: 41.1%2016: 56.7% (as of 2015)
Source: Bureau of Labor Statistics, Labor Force Statistics from the Current Population Survey
<http://data.bls.gov/timeseries/LNU01300002?from_year=1967&periods_option=specific_periods&periods=Annual+Data>
Percentage of the Population, Age 25 and Older, who had at Least a High School Diploma
1967: 51.1%2016: 88.3% (as of 2014)
Sources: U.S. Census Bureau, 1967 Current Population Survey
<http://www.census.gov/hhes/socdemo/education/data/cps/1967/p20-169.pdf>
U.S. Census Bureau, 2014 Current Population Survey
<http://www.census.gov/hhes/socdemo/education/data/cps/2014/tables.html>
Median Annual Household Income
1967: $7,143 ($44,282 in 2014 dollars)2016: $53,657 (as of 2014)
Sources: 1968 and 2015 Current Population Survey Annual Social and Economic Supplements.
Table H5.
http://www.census.gov/hhes/www/income/data/historical/household/2014/h05.xls
Most Popular Baby Names for Boys and Girls
1967: Michael and Lisa2016: Noah and Emma (as of 2014)
Source: Social Security Administration, Most Popular Baby Names
<https://www.ssa.gov/OACT/babynames/index.html>
Active-Duty Military Personnel
1967: 3.4 million2016: 1.3 million (as of Nov. 30, 2015)
Sources: U.S. Census Bureau, 1969 Statistical Abstract
<http://www2.census.gov/library/publications/1969/compendia/statab/90ed/1969-05.pdf>
Department of Defense
<https://www.dmdc.osd.mil/appj/dwp/dwp_reports.jsp>
Denver Broncos
21st
Where Denver ranked on the list of the nation’s most populous metropolitan areas. The estimated population of the Denver-Aurora-Lakewood, Colo., metro area on July 1, 2014, was 2,754,258. The Denver area gained 54,508 people from July 1, 2013, to July 1, 2014. At the time of the Broncos’ first season in 1960, the 1960 Census population for the city of Denver was 493,887.Sources: Vintage 2014 Population Estimates, 1960 Census <http://factfinder.census.gov/bkmk/table/1.0/en/PEP/2014/PEPANNCHG.US24PR>
<http://www.census.gov/prod/www/decennial.html>
40.8%
Percentage of Denver metro area residents 25 and older who had a bachelor’s degree or higher in 2014; 89.7 percent had at least graduated from high school. The respective national figures were 30.1 percent and 86.9 percent.Source: 2014 American Community Survey
<>
20.6%
Percentage of Denver metro area residents 5 and older who spoke a language other than English at home. The national average was 21.1 percent. These figures are not statistically different.Source: 2014 American Community Survey
<>
$66,870
Median household income for the Denver metro area. The national median was $53,657.Source: 2014 American Community Survey
<>
$276,800
Median home value of owner-occupied homes in the Denver metro area. The national median was $181,200.Source: 2014 American Community Survey
<>
27.4 minutes
Average amount of time it took Denver metro area residents to get to work; 76.3 percent of the metro area’s workers drove to work alone, 8.8 percent carpooled and 4.5 percent took public transportation. Nationally, it took an average of 26.0 minutes to get to work.Source: 2014 American Community Survey
<>
Carolina Panthers
22nd
Where Charlotte ranked on the list of the nation’s most populous metropolitan areas. The estimated population of the Charlotte-Concord-Gastonia, N.C.-S.C., metro area on July 1, 2014, was 2,380,314. The Charlotte area gained 42,975 people from July 1, 2013, to July 1, 2014. At the time of the Panthers’ first season in 1995, the July 1, 1995, estimated population for the city of Charlotte was 473,355.Sources: Vintage 2014 Population Estimates, Population Estimates for the Years 1994-1999
<http://factfinder.census.gov/bkmk/table/1.0/en/PEP/2014/PEPANNCHG.US24PR>
<https://www.census.gov/popest/data/cities/totals/1990s/SU-99-07.html>
32.9%
Percentage of Charlotte metro area residents 25 and older who had a bachelor’s degree or higher in 2014; 88.1 percent had at least graduated from high school. The respective national figures were 30.1 percent and 86.9 percent.Source: 2014 American Community Survey
<>
13.3%
Percentage of Charlotte metro area residents 5 and older who spoke a language other than English at home. The national average was 21.1 percent.Source: 2014 American Community Survey
<>
$53,549
Median household income for the Charlotte metro area. The national median was $53,657. These figures are not statistically different.Source: 2014 American Community Survey
<>
$169,400
Median home value of owner-occupied homes in the Charlotte metro area. The national median was $181,200.Source: 2014 American Community Survey
<>
26.1 minutes
Average amount of time it took Charlotte metro area residents to get to work; 81.0 percent of the metro area’s workers drove to work alone, 9.4 percent carpooled and 1.9 percent took public transportation. Nationally, it took an average of 26.0 minutes to get to work, which is not statistically difference from the Charlotte metro area’s time.Source: 2014 American Community Survey
<>
Host Site
122,192
Population of Santa Clara, Calif., location of Levi’s Stadium where Super Bowl 50 will be played.Source: QuickFacts, Vintage 2014 Population Estimates
<http://www.census.gov/quickfacts/table/PST045214/0669084,00>
219th
Where Santa Clara ranked on the list of the nation’s most populous cities. Santa Clara is part of the San Jose-Sunnyvale-Santa Clara, Calif., metropolitan area.Source: Vintage 2014 Population Estimates
<http://www.census.gov/popest/data/cities/totals/2014/index.html>
34th
Where the San Jose-Sunnyvale-Santa Clara, Calif., metropolitan area ranked on the list of the nation’s most populous metro areas. The estimated population of the San Jose metro area on July 1, 2014, was 1,952,872. The San Jose metro area gained 24,171 people from July 1, 2013, to July 1, 2014.Source: Vintage 2014 Population Estimates
<http://www.census.gov/popest/data/metro/totals/2014/index.html>
47.5%
Percentage of San Jose metro area residents 25 and older who had a bachelor’s degree or higher in 2014; 87.2 percent had at least graduated from high school. The respective national figures were 30.1 percent and 86.9 percent. The high school graduation figures are not statistically different.Source: 2014 American Community Survey
<>
51.8%
Percentage of San Jose metro area residents 5 and older who spoke a language other than English at home. The national figure was 21.1 percent.Source: 2014 American Community Survey
<>
$96,481
Median household income for the San Jose metro area. The national median was $53,657.Source: 2014 American Community Survey
<>
$735,400
Median home value of owner-occupied homes in the San Jose metro area. The national median was $181,200.Source: 2014 American Community Survey
<>
27.0 minutes
Average amount of time it took San Jose metro area residents to get to work; 76.2 percent of the metro area’s workers drove to work alone, 10.4 percent carpooled and 4.0 percent took public transportation. Nationally, it also took an average of 26.0 minutes to get to work.Source: 2014 American Community Survey
<>
Source: Census Bureau

