
California pending home sales lose steam for fourth straight month in April
June 5, 2017 - LOS ANGELES – Consistent with the slowdown in April’s closed escrow sales, which declined from the previous month and year, low housing inventory and eroding affordability suppressed pending home sales for the fourth straight month, the CALIFORNIA ASSOCIATION OF REALTORS® (C.A.R.) said on May 24.
C.A.R.’s April Market Pulse Survey** saw mixed results as REALTORS® reported an increase in floor calls for the fourth straight month, but less open house traffic, and no change in listing appointment activity compared with the previous month.
Pending home sales data:
• Based on signed contracts, year-over-year statewide pending home sales declined for the fourth straight month in April on a seasonally adjusted basis, with the Pending Home Sales Index (PHSI)* declining 7.4 percent from 122.8 in April 2016 to 113.7 in April 2017. On a monthly basis, California pending home sales increased 5.9 percent from the March index of 107.4.
• April’s year-over-year pending sales decline is the largest since July 2014, when sales decreased 9.1 percent from the previous year. The quickening pace of pending sales declines provides further evidence that the typically busy spring home buying season may underperform, primarily due to demand outstripping the supply of active listings, which was 10.5 percent lower than in April a year ago.
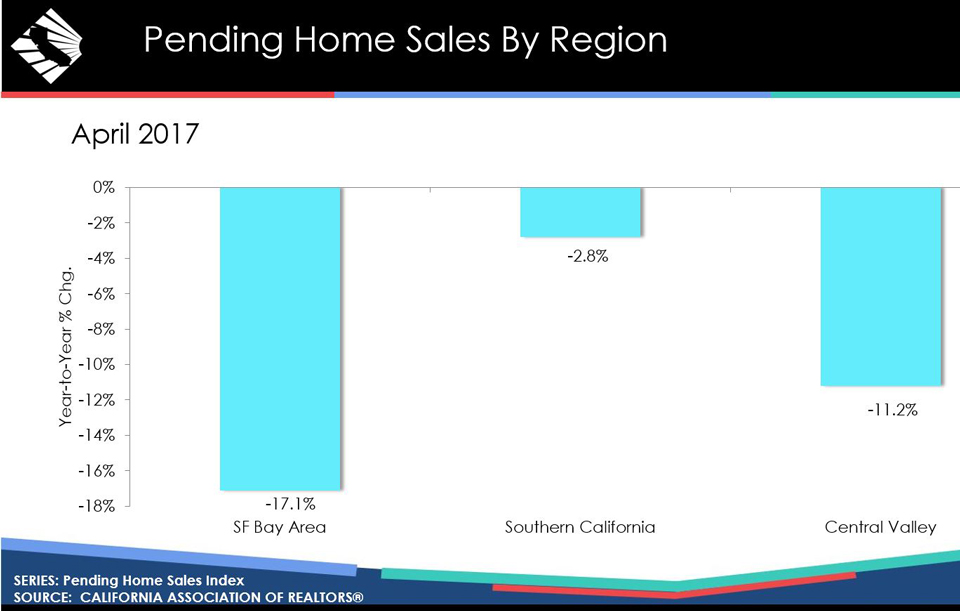
• At the regional level, Southern California was the most resilient region in the state, where pending sales held on for a modest decline of 2.8 percent, aided in large part by a 2 percent increase in Riverside County and a 1.1 percent uptick in Orange County. San Diego posted a double-digit decline of 11.1 percent. Los Angeles County saw pending sales decline 4.7 percent, and San Bernardino pending sales fell 4 percent.
• At the opposite end of the spectrum, the San Francisco Bay Area bore the brunt of the slowdown. On a year over year basis, pending sales in April were 17.1 percent below where they were in April 2016. San Francisco, San Mateo, and Santa Clara all posted double-digit declines in pending sales (down 16.1 percent, 12.2 percent, 14.6 percent, respectively) as inventories remained between 1.8 and 2 months of supply with median prices of more than $1 million.
• The Central Valley also posted a double-digit decline of 11.2 percent in April. Despite the rebounding energy sector and relative affordability, Kern County saw pending sales shrink by 15.5 percent from April 2016. However, Fresno, Kings, Madera, and Merced were already seeing closed sales begin to stumble back in March, and this weak reading on pending sales suggests that the sluggishness of sales will persist in the Central Valley over the near term as well.
• In C.A.R.’s newest market indicator of future price appreciation, Market Velocity – home sales relative to the number of new listings coming on line each month to replenish that sold inventory – suggests that price growth will begin to accelerate this summer. With demand remaining strong and inventories tightening further, price pressure will get more intense over the next six months and that median price growth may accelerate into the high single digits through the fall. Market Velocity is strongly correlated with increases/decreases in price growth with a roughly three- to six-month lag time.
Year-to-Year Change in Pending Sales by County/Region
| County/Region/State | Apr-17 | Apr-16 | Yearly % Change |
| Counties | |||
| Kern | 77.4 | 91.6 | -15.5% |
| Los Angeles | 91.3 | 95.8 | -4.7% |
| Orange | 88.5 | 87.6 | 1.1% |
| Riverside | 64.8 | 63.5 | 2.0% |
| San Diego | 139.8 | 157.2 | -11.1% |
| San Bernardino | 79.5 | 82.8 | -4.0% |
| Monterey | 61.2 | 80.2 | -23.7% |
| Sacramento | 68.4 | 81.8 | -16.3% |
| San Francisco | 81.1 | 96.7 | -16.1% |
| San Mateo | 95.3 | 108.6 | -12.2% |
| Santa Clara | 98.8 | 115.6 | -14.6% |
| Santa Cruz | 90.1 | 109.2 | -17.6% |
| Regions | |||
| San Francisco Bay Area | 141.0 | 170.0 | -17.1% |
| Southern California | 106.3 | 109.4 | -2.8% |
| Central Valley | 115.6 | 130.2 | -11.2% |
| California (SA)* | 113.7 | 122.8 | -7.4% |
April REALTOR® Market Pulse Survey**:
Entering the spring homebuying season, California REALTORS® responding to C.A.R.’s April Market Pulse Survey said their expectations for market conditions of the next year declined from April as they experienced less open house traffic, fewer multiple offers, more price reductions, and no change in listing appointment activity compared with March.
• The share of homes selling above asking price dipped from 32 percent a year ago to 31 percent in April, while the share of properties selling below asking price slipped to 38 percent from 40 percent in April 2016. The remaining 31 percent sold at asking price, up from 28 percent in April 2016.
• For homes that sold above asking price, the premium paid over asking price was essentially unchanged from a year ago, at 10 percent.
• The 38 percent of homes that sold below asking price sold for an average of 17 percent below asking price in April, compared to 12 percent a year ago.
• The share of properties receiving multiple offers declined in April after trending higher for three straight months. About two-thirds of properties sold (68 percent) received multiple offers in April, down from 69 percent in April 2016.
• The share of properties receiving three or more offers in April was 44 percent, compared to 45 percent a year ago.
• Only homes priced $500,000-$749,000 and $2 million and higher posted gains in receiving three or more offers compared with last year, rising from 53 percent to 61 percent, and 50 percent and 63 percent, respectively.
• After falling for four consecutive months, listing price reductions rose to 26 percent in April, up from 23 percent in April 2016.
• A lack of available inventory continued to be the top concern for 48 percent of REALTORS®, the highest level recorded. Eroding housing affordability/high interest rates concerned 19.5 percent of REALTORS®. Inflated home prices/housing bubble was cited by 19.5 percent of REALTORS®. A slowdown in economic growth, lending and financing, and policy and regulations rounded out REALTORS®’ remaining biggest concerns.
• REALTORS®’ expectations of market conditions over the next year remained high at an index of 64, up from an index of 60 a year ago.
Graphics (click links to open):
• YTY change in pending home sales by region.
• Pending sales vs. closed escrow sales.
• Share of properties receiving multiple offers.
• Price range of homes receiving 3+ offers.
• Lack of inventory tops REALTORS®’ concerns.
• Market Velocity – indicator of future price appreciation.
*Note: C.A.R.’s pending sales information is generated from a survey of more than 70 associations of REALTORS® and MLSs throughout the state. Pending home sales are forward-looking indicators of future home sales activity, offering solid information on future changes in the direction of the market. A sale is listed as pending after a seller has accepted a sales contract on a property. The majority of pending home sales usually become closed sales transactions one to two months later. The year 2008 was used as the benchmark for the Pending Homes Sales Index. An index of 100 is equal to the average level of contract activity during 2008.
**C.A.R.’s Market Pulse Survey is a monthly online survey sent to more than 10,000 California REALTORS® to measure data about their last closed transaction and sentiment about business activity in their market area for the previous month. More than 400 REALTORS® responded.
Leading the way...® in California real estate for more than 110 years, the CALIFORNIA ASSOCIATION OF REALTORS® (www.car.org) is one of the largest state trade organizations in the United States with more than 190,000 members dedicated to the advancement of professionalism in real estate. C.A.R. is headquartered in Los Angeles.
Source: C.A. R.