
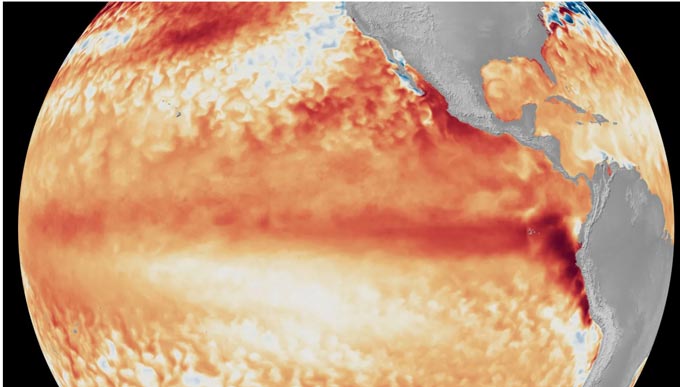
Satellite imagery showing the difference from average sea surface temperatures at the equator in the tropical Pacific Ocean (depicted using various shades of red and orange for warmth) during the first week of June 2026, as compared with the baseline used by NOAA’s Coral Reef Watch. (Image credit: NOAA Satellites )
The Pacific Ocean’s El Niño-Southern Oscillation (ENSO) is arguably the most influential climate driver on Earth. Its cycles of warm and cool waters in the central and eastern equatorial Pacific alter where ocean heat is released into the atmosphere, influencing atmospheric circulation, temperatures, precipitation and other weather events that affect agriculture, wildfires and marine fisheries around the globe.
June 15, 2026 - El Niño, the warm phase of ENSO, occurs on average every two to seven years, and typically lasts nine to 12 months. El Niño exerts its largest impacts on the Northern Hemisphere during the winter, typically bringing milder weather to the northern parts of the United States and wetter conditions across the southern United States. The opposite of El Niño is La Niña, the cool phase, which also changes weather worldwide. The transition between El Niño and La Niña, between one to six months, is characterized by average water temperatures in the equatorial Pacific. All three stages together are referred to as ENSO or the El Niño-Southern Oscillation.
Related: NOAA Forecasters Says El Nino Forms, Expected To Strengthen, Prolonged Period Of Above-Average Temperatures In The Equatorial Pacific And Expected To Peak This Winter Of 2026-2027
In the U.S., NOAA declares when an El Niño or La Niña event has begun. For El Niño conditions to form, monthly sea surface temperatures in the central and eastern tropical Pacific Ocean (Nino 3.4 region) need to warm +0.5° Celsius above normal, persisting for at least five consecutive overlapping three-month periods. In addition, the atmosphere must respond to the warming water by weakening the prevailing winds, known as the trade winds, and also shift patterns of tropical rainfall eastward. This ocean–atmosphere coupling impacts the position of the Pacific jet stream and influences weather and climate patterns globally.
")
Climate records of El Niño go back millions of years, with evidence of the cycle found in ice cores, deep sea muds, coral, caves and tree rings. In the 1600s, Peruvian fishermen harvesting off the coast of South America first recognized the phenomenon when changing ocean currents caused a drastic drop in their catch. They named it El Niño or “Little Boy” in Spanish because it typically occurred around Christmas.
While El Niño's impacts are most strongly felt in the tropics, its effects can disrupt local weather patterns around the world, having positive and negative consequences.
As the trade winds weaken and the warm tropical Pacific Ocean water sloshes to the east, increased heat and moisture rises into the atmosphere in the central and eastern tropical Pacific Ocean, altering weather patterns in neighboring regions and around the globe.
")
A strong El Niño will shift the Pacific jet stream, which helps determine temperature and precipitation patterns over the United States and alters the track of winter storms -- leading to more winter storms over California and the southern United States. Record rainfall often strikes Peru, Chile and Ecuador during an El Niño year. In contrast, El Niño can also cause severe droughts over Australia, Indonesia, and parts of southern Asia.
During the summer, El Niño’s warm water can fuel hurricanes in the central/eastern Pacific Ocean, while it hinders the hurricane formation in the Atlantic Basin. In the winter, when El Niño impacts are felt strongest, it typically brings wetter and cooler than normal conditions across the southern part of the United States from central California to Florida and up the East Coast. Warmer and drier than average conditions are typical for the northern tier of the U.S. to the Great Lakes. The strength — weak, moderate, strong, or very strong — of an individual El Niño influences the odds of these outcomes.
Warmer ocean temperatures and altered currents during El Niño cause changes in the distribution and abundance of fish and other species off the coast of northern South America; marine life migrates north and south, following colder water. During strong El Niños, these changes can be seen as far north as the Gulf of Alaska.
NOAA researchers and scientists have made tremendous advances since the 1980s, when forecasting of El Niño began.
Forecasters at NOAA’s National Weather Service rely on a variety of observations from satellites, moored buoys, drifting buoys, sea level analysis and ships. The data are fed into computer models and used for guidance to make a forecast. A team of 10 forecasters issue a consensus forecast the second Thursday of each month.
It is difficult to predict the onset of an El Niño, because a series of events related to the warming Pacific Ocean need to take place. Once an El Niño has started, forecasters have reasonably good skill in predicting its intensity and evolution.
One of the most important datasets for El Niño prediction is the temperature of the sea surface in the equatorial Pacific Ocean. Forecasters also closely monitor whether the atmosphere is responding to the warming ocean by causing tropical trade winds to weaken or reverse and blow west to east toward South America. This coupling of the ocean and atmosphere is necessary for El Niño to exist.
NOAA forecasters categorize El Niños as weak, moderate, strong or very strong. Not all El Niños are the same, and the atmosphere and ocean don't always follow the same patterns from one El Niño to another.
For more than four decades, NOAA researchers have investigated the processes that drive the El Niño-Southern Oscillation (ENSO) in order to better predict the global climate phenomenon and its effects on everything from weather to agriculture to fisheries. NOAA scientists have led the world in developing technology and scientific methods to detect changes in the Pacific Basin in real time that form the foundation of El Niño predictions.
In the early 1980s, NOAA scientists understood that a key to detecting the onset of El Niño was real-time data on ocean temperatures in the Pacific Basin. The 1982-1983 El Niño, the strongest to that point, prompted NOAA to build the Tropical Atmosphere Ocean (TAO) Array, a foundational network of approximately 70 moored ocean buoys deployed across the equatorial Pacific Ocean. These buoys measure wind speed, wind direction, atmospheric pressure, air temperature and near-surface water temperature; they transmit this information immediately by satellite for use by forecasters, research scientists, water manager, and those working in agriculture, fisheries, public health, risk management and ecological resource management.
The TAO story: Developing an El Niño observing systemReal-time data from moored ocean buoys improves detection, understanding and prediction of El Niño and La Niña. (NOAA)
Since 2014, NOAA and the Japan Agency for Marine-Earth Science Technology have led an international effort to improve this early warning system. The Tropical Pacific Observing System (TPOS) is a broader, modernized, integrated observational frameworkoffsite link that incorporates measurements from the TAO array with additional types of data collected by satellites, Argo floats, and drifters. Essentially, TAO provides point-based mooring measurements, while TPOS provides a comprehensive regional observing system.
On February 1, 2026, NOAA transitioned to operational use of the Relative Oceanic Nino Index, or RONI. RONI is based on the difference between the traditional Oceanic Nino Index and tropical mean sea surface temperature departures (SSTs). RONI more accurately characterizes the expected atmospheric response to SST anomalies in the ENSO region of the Pacific consistent with El Niño or La Nina. Because it subtracts out the tropical mean SSTs, RONI is less dependent on the chosen 30-year average. Therefore, RONI more reliably identifies El Niño and La Niña events in the historical record and in real-time monitoring and forecasting.
NOAA researchers also study the larger processes that drive El Niño impacts globally. These activities provide environmental information to assist with real world problems such as better ways to anticipate drought, increased wildfires, flooding and threats to food security. Scientists analyze historical patterns to develop ways to distinguish different types of El Niño events and their signature effects. NOAA climate modelers are engaged in vigorous efforts to understand and simulate ENSO, to forecast its effects on seasonal-to-interannual time scales, and to predict how its impacts may change over the coming decades.
Source: NOAA