


February 3, 2018 - By Nat Johnson - Currently, we are fully immersed in the second winter of a “double-dip” La Niña. Although it will take some time before we can see how this event stacked up with past events, you might have noticed that it has been quite dry over much of the U.S. this winter, with drought expanding across several regions, particularly in the south. Being the big ENSO fans that you are, you might have asked yourself, are these conditions typical in the second winter of a double-dip La Niña? And are there any differences in how the atmosphere responds to La Niña in the second winter relative to the first? Well if either of those questions ever crossed your mind, then you’re in luck!
A recent study (1) led by Dr. Yuko Okumura of the University of Texas at Austin addressed how the impacts of La Niña may change from the first winter to the second for double-dip La Niñas like this one. Spoiler alert: Dr. Okumura and colleagues found evidence that U.S. drought and the North Pacific atmospheric circulation anomalies strengthen in the second winter of a double-dip La Niña. With that out of the way, let’s take a closer look at what they found.
Punching above its weight
As Emily discussed recently and as Dr. Okumura’s team also acknowledged, double-dip La Niñas actually are pretty common. Including the current event, we have experienced eight instances in which La Nina conditions in the first winter were followed by La Niña in the subsequent winter.
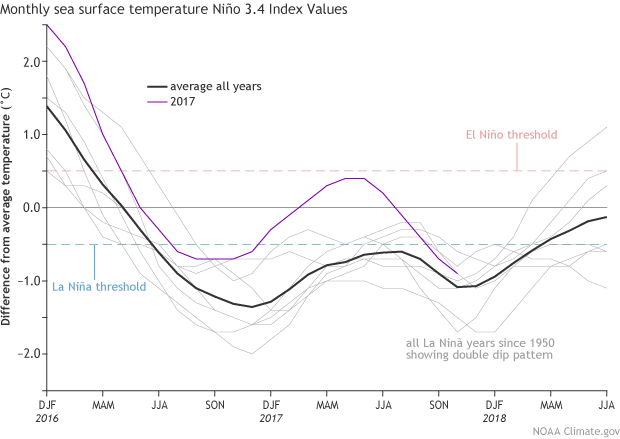
Three-month seasonal sea surface temperature in the Niño 3.4 region of the tropical Pacific compared to the long-term average for all multi-year La Niñas since 1950, showing how the average Niño 3.4 amplitude (black line) evolves in time. The purple line shows the evolution since December-March of 2015, and the light grey lines show the other seven events. Multi-year La Niña events are defined as at least 2 years in a row where the La Niña criteria are met. Both continuous events, when the Oceanic Niño Index remained below -0.5°C, and years when the ONI warmed mid-year before again cooling, are included here. Climate.gov graph based on ERSSTv5 temperature data.
When we look at the average surface temperatures in the Niño 3.4 region for the seven events prior to the current one, we see a tendency for the surface temperature departures from average to weaken in the second winter relative to the first (the current La Niña is an exception to this tendency, as the peak amplitude this winter is stronger than it was last winter).
Given that Niño 3.4 temperature departures in the second winter tend to be weaker, shouldn’t we then expect the impacts of La Nina on our climate to be weaker in the second winter as well? This is the question that Dr. Okumura’s team addressed. They analyzed a larger pool of multi-year La Niña episodes dating back to 1900 (2), identifying 10 (not including the current one), and compared the average climate impacts in the first winter with those during the second winter (November – April).
Consistent with the plot shown above, they found that sea surface temperature anomalies in the Niño3.4 region tend to be about 25-30% weaker in the second La Niña winter relative to the first. Surprisingly, however, they also found that the atmospheric circulation departures from average over the North Pacific and North America region tend to be stronger in the second winter.
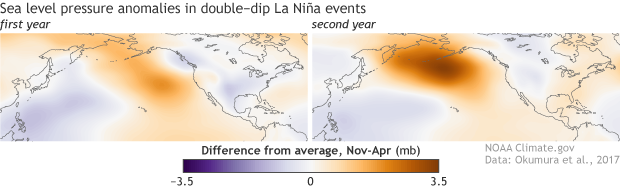
Average sea level pressure anomalies (millibars) during November–April for the first (left) and second (right) extended winters of all multi-year La Niñas since 1900. Anomalies are compared to the 1900-2012 average, with the linear trend removed. Climate.gov figure from 20CR data and adapted from Okumura et al. (2017).
The anomalous high pressure over the North Pacific, a characteristic feature of La Niña, is, on average, stronger in the second winter. These atmospheric circulation anomalies have big implications for the impacts over North America. Most notably, the occurrence of drought conditions tends to be worse over regions like California and the U.S. Southeast, which also are regions that have been dry so far this winter.
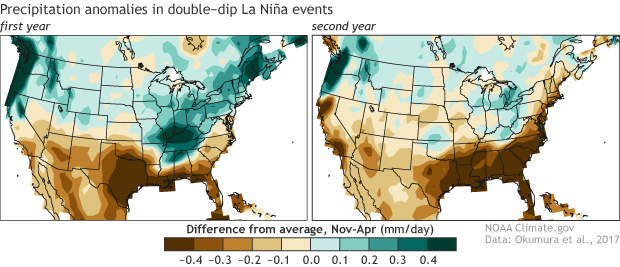
Average precipitation anomalies (mm/day) for November–April for the first (left) and second (right) extended winters of all multi-year La Niñas since 1900. Anomalies are compared to the 1900-2012 average, with the linear trend removed. Climate.gov figure from GPCC data and adapted from Okumura et al. (2017).
Okay, so what’s the catch?
At this point, you may be scratching your head: I’m telling you that weaker La Niña sea surface temperature anomalies in the second winter can lead to stronger impacts. Don’t worry, a healthy dose of skepticism is a good thing! The million-dollar question is why. Dr. Okumura’s team speculates that north-south differences in the sea surface temperature contrast between the first and second winters may provide the answer.
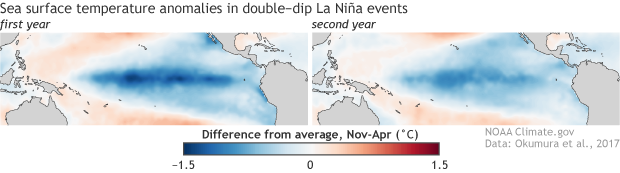
Average sea surface temperature anomalies in November–April for the first (left) and second (right) extended winters of all multi-year La Niñas since 1900. Anomalies are compared to the 1900-2012 average, with the linear trend removed. Climate.gov figure from HadISST data and adapted from Okumura et al. (2017).
Weaker Niño 3.4 sea surface temperature anomalies mean that the contrast, or gradient, between the temperature departures at the equator and the subtropics are not as sharp in the second winter. This north-south smoothing of below-average temperatures can influence the overlying tropical rainfall, which then alters the large-scale atmospheric circulation. Additional analysis by the team reveals that smoother, less equatorially peaked ocean patterns are closely connected with a stronger, more west–to-east elongated Aleutian high-pressure system, like what we tend to see in the second winter of a double-dip La Niña.
Case closed?
So does this study settle the case of worsening drought in a second-year La Niña? Let’s not jump to conclusions without acknowledging the study’s limitations. (Piece of advice: if anyone ever tells you that a single study is the last word on a particular topic, be very skeptical!) One familiar limitation is the small sample sizes in the historical record (oh, what ENSO scientists would do for another 200 years of reliable historical data!).
With only 10 cases to work with, historical analysis alone cannot rule out the role of randomness, or chaos, in many of the differences between the first and second La Niña winters. In other words, random weather variations unrelated to La Niña (“noise”) could have a bigger influence on the circulation than the part caused by La Niña (“signal”). Dr. Okumura’s team found that some of the differences in circulation and U.S. precipitation are robust after performing the appropriate statistical tests, but other differences are more uncertain (3).
In terms of U.S. precipitation, the most robust differences identified in the study are found in the Tennessee Valley. Therefore, on the basis of the historical analysis, we may have greatest confidence in the tendency for the Tennessee Valley to be drier in the second winter than in the first.
Although the case on the differences between first and second winter climate impacts of La Niña may not yet be closed, such definitive conclusions should never be the expectation. This is how science progresses—novel ideas are presented, hypotheses are tested, questions remain, and then hypotheses are refined and tested further. For now, we can conclude that just because a La Niña may be weaker in the second winter than in the first, don’t be certain that the impacts will be weaker in the second winter—double-dip La Niñas still can pack a punch!
We thank Dr. Yuko Okumura for providing figures and comments on this post!
Footnotes
(1) Okumura, Y. M., DiNezio, P., & Deser, C. (2017). Evolving impacts of multiyear La Niña events on atmospheric circulation and U.S. drought. Geophysical Research Letters, 44. https://doi.org/10.1002/2017GL075034
(2) In contrast with the NOAA Climate Prediction Center, which monitors ENSO events with ERSSTv5b Niño 3.4 sea surface temperature data since 1950, Dr. Okumura’s team identified ENSO episodes since 1900 with the Hadley Centre Sea Ice and Sea Surface Temperature data set (HadISST). The two datasets are consistent in the double-dip La Niña episodes identified since 1950.
(3) Given the limitations of the short historical record, climate scientists often attempt to solidify their hypotheses and strengthen their understanding by conducting experiments with climate model simulations. If climate models can simulate the physical mechanisms connecting La Niña variations and their climate impacts, then scientists can design experiments that target the sources of La Niña impacts and overcome the limitations of small sample sizes.
Dr. Okumura’s team analyzed such a set of experiments, and the results were mixed, with one particular model agreeing with the general differences in North Pacific circulation that we see in observations, but another model disagreeing with the historical analysis. Why did one model see a similar pattern but the other did not? This is the sort of challenging question that climate scientists grapple with all the time.
A blog about monitoring and forecasting El Niño, La Niña, and its impacts.
Disclaimer:
The ENSO blog is written, edited, and moderated by Michelle L’Heureux (NOAA Climate Prediction Center), Emily Becker and Tom Di Liberto (contractors to CPC), Nat Johnson (NOAA Geophysical Fluid Dynamics Laboratory), and Rebecca Lindsey (contractor to NOAA Climate Program Office), with periodic guest contributors. Ideas and explanations found in these posts should be attributed to the ENSO blog team, and not to NOAA (the agency) itself.
Source: NOAA
Related Information: NOAA: Why Did It Rain So Much In California During Last Year’s La Niña?
