


Key Highlights
- Pending home sales decreased for the sixth consecutive month, down 4.0% from October.
- Month-over-month, contract signings declined in all four major U.S. regions.
- Pending sales fell in all regions compared to one year ago.
December 29, 2022 - WASHINGTON – Pending home sales slid for the sixth consecutive month in November, according to the National Association of REALTORS®. All four U.S. regions recorded month-over-month decreases, and all four regions saw year-over-year declines in transactions.
"Pending home sales recorded the second-lowest monthly reading in 20 years as interest rates, which climbed at one of the fastest paces on record this year, drastically cut into the number of contract signings to buy a home," said NAR Chief Economist Lawrence Yun. "Falling home sales and construction have hurt broader economic activity."
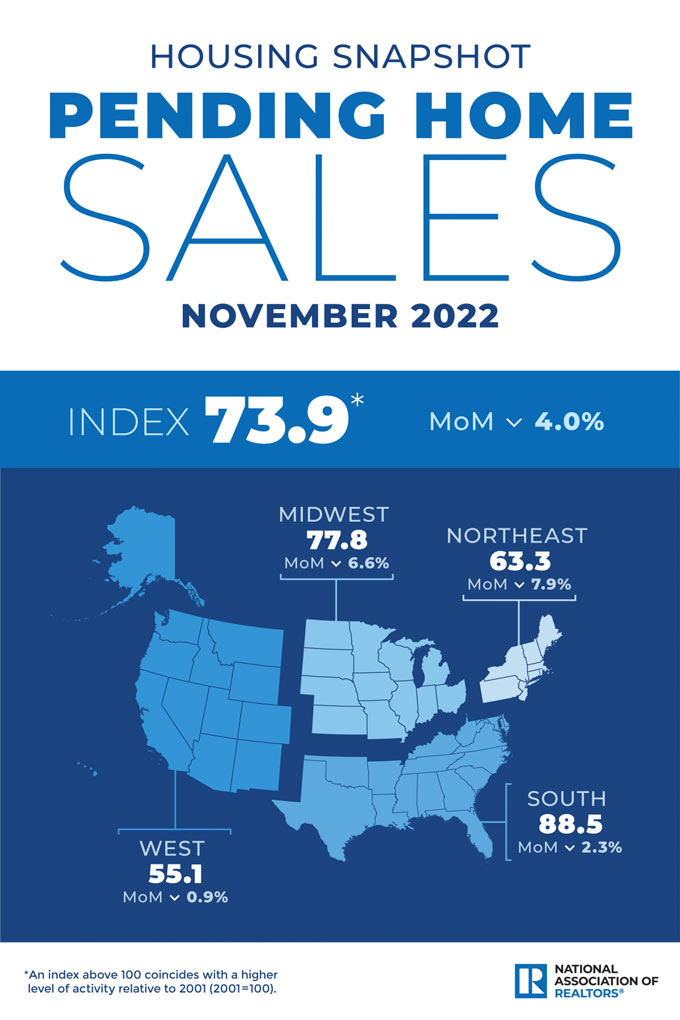
The Pending Home Sales Index (PHSI)* — a forward-looking indicator of home sales based on contract signings — fell 4.0% to 73.9 in November. Year-over-year, pending transactions dropped by 37.8%. An index of 100 is equal to the level of contract activity in 2001.
"The residential investment component of GDP has fallen for six straight quarters," Yun added. "There are approximately two months of lag time between mortgage rates and home sales. With mortgage rates falling throughout December, home-buying activity should inevitably rebound in the coming months and help economic growth."
Pending Home Sales Regional Breakdown
The Northeast PHSI slipped 7.9% from last month to 63.3, a drop of 34.9% from November 2021. The Midwest index decreased 6.6% to 77.8 in November, a fall of 31.6% from one year ago.
The South PHSI retracted 2.3% to 88.5 in November, fading 38.5% from the prior year. The West index dropped by 0.9% in November to 55.1, retreating 45.7% from November 2021.
"The Midwest region — with relatively affordable home prices — has held up better, while the unaffordable West region suffered the largest decline in activity," Yun said.
The National Association of REALTORS® is America's largest trade association, representing more than 1.5 million members involved in all aspects of the residential and commercial real estate industries. The term REALTOR® is a registered collective membership mark that identifies a real estate professional who is a member of the National Association of REALTORS® and subscribes to its strict Code of Ethics.
*The Pending Home Sales Index is a leading indicator for the housing sector, based on pending sales of existing homes. A sale is listed as pending when the contract has been signed but the transaction has not closed, though the sale usually is finalized within one or two months of signing.
Pending contracts are good early indicators of upcoming sales closings. However, the amount of time between pending contracts and completed sales is not identical for all home sales. Variations in the length of the process from pending contract to closed sale can be caused by issues such as buyer difficulties with obtaining mortgage financing, home inspection problems, or appraisal issues.
The index is based on a sample that covers about 40% of multiple listing service data each month. In developing the model for the index, it was demonstrated that the level of monthly sales-contract activity parallels the level of closed existing-home sales in the following two months.
An index of 100 is equal to the average level of contract activity during 2001, which was the first year to be examined. By coincidence, the volume of existing-home sales in 2001 fell within the range of 5.0 to 5.5 million, which is considered normal for the current U.S. population.
Source: National Association of REALTORS®

