


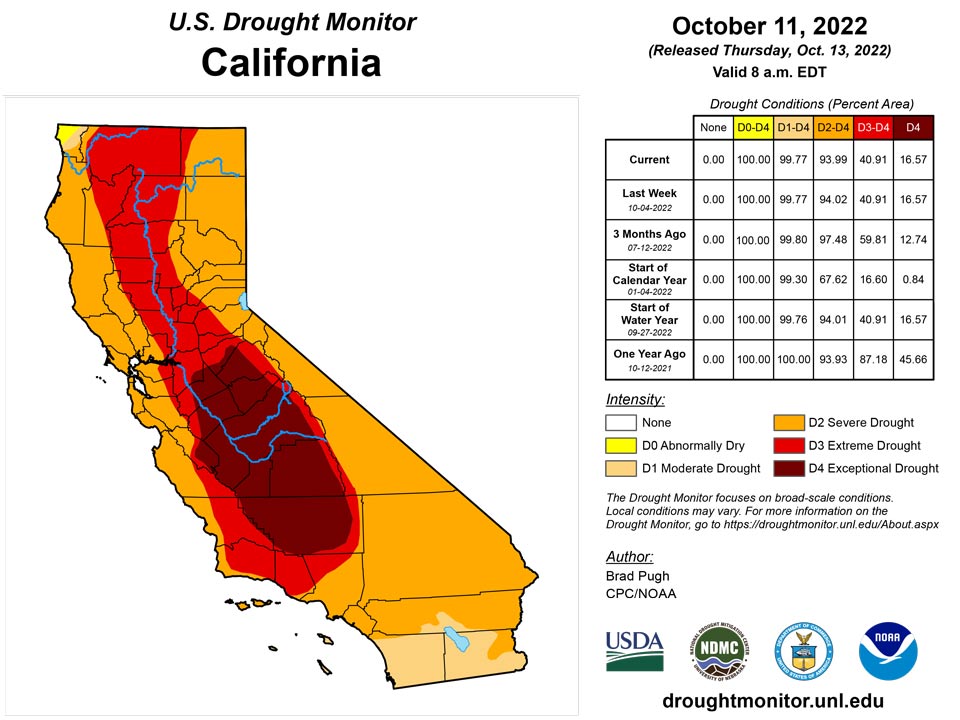
California and National Drought Summary for October 11, 2022
Summary
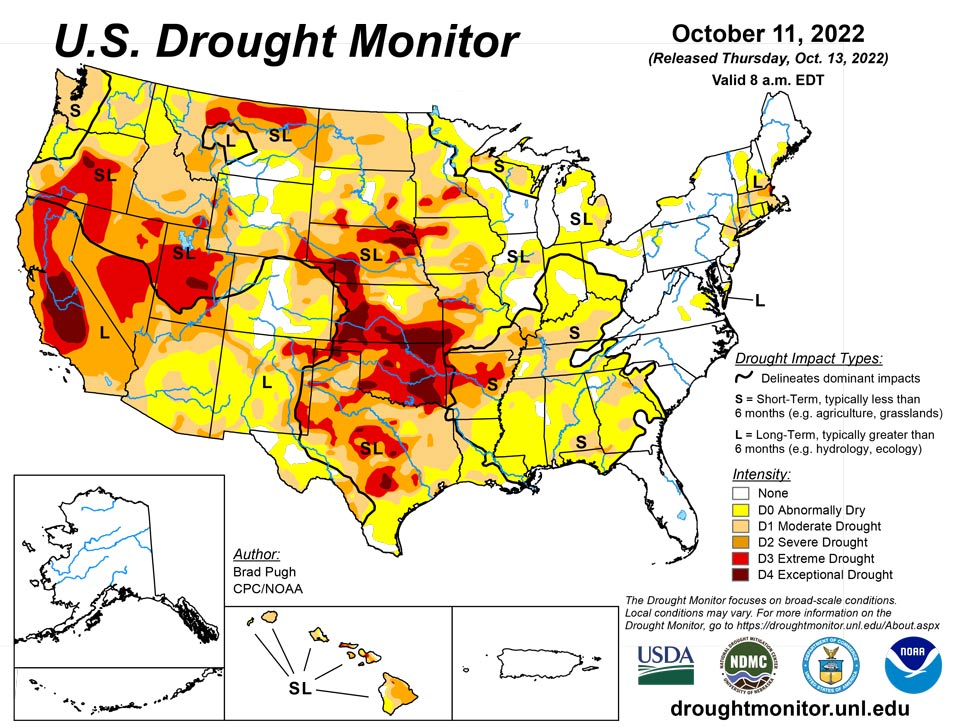
October 13, 2022 - Following a drier-than-normal September for a majority of the contiguous U.S., this dry pattern continued into early October for many areas. Therefore, drought coverage increased and intensified throughout the Pacific Northwest, Great Plains, Ohio River Valley, and Southeast. From October 4-10, heavy rainfall (1 to 3 inches) was limited to the northern Mid-Atlantic, southern New England, and parts of the Southwest. New Mexico was especially wet this past week and this much above-normal precipitation extended eastward into west Texas. 7-day temperatures, ending on October 10, averaged above-normal across the West. Cooler-than-normal temperatures were observed from the Mississippi Valley to the East Coast with the first freeze of the season affecting parts of the Midwest.
Northeast
Heavy rainfall (1 to 3 inches) lingered across the northern Mid-Atlantic and parts of the Northeast through October 4 and 5 which led to another week of improvements for these areas. From October 1 to 6, the southern two-thirds of New Jersey received 4 to 8 inches, resulting in the end of drought for much of the state. Farther to the north, a 1-category improvement was made to parts of southeastern New York, Long Island, and Massachusetts due to recent wetness. Conversely, a slight expansion of abnormal dryness (D0) occurred in New Hampshire.
Southeast
A lack of rainfall (less than one inch) during the past 30 days resulted in a large expansion of abnormal dryness (D0) across Alabama, Georgia, the Florida Panhandle, and the western Carolinas. Soil moisture indicators and impact reports supported an increasing coverage of moderate drought (D1) in northeastern Georgia and adjacent areas of South Carolina. Impact reports from these areas include poor pasture conditions and low ponds. D1 was also increased in southeastern Alabama and southwestern Georgia with a small introduction of severe drought (D2), based on soil moisture indicators and 30-day SPI.
South
Widespread, heavy precipitation (1 to 3 inches) during early October along with a wet 2022 Monsoon supported large-scale improvements across New Mexico. These improving drought conditions extended eastward to include western Texas. During the past week, rainfall amounts ranged from 2 to 4 inches, locally more, across the Davis Mountains, Trans Pecos, and southern Permian Basin of western Texas. Farther to the east across central and eastern Texas, another week of degradations were made. Based on 120-day, soil moisture, and impact reports, the coverage of D3 (extreme) to D4 (exceptional) drought was expanded across parts of Oklahoma. Rainfall was not enough to justify any improvements in southwestern Oklahoma with little to no response in soil moisture. Increasing 30-day deficits resulted in a 1-category degradation across parts of Arkansas, Louisiana, Mississippi, and Tennessee. The expanding D3 area in Arkansas was based on 30 to 60-day SPI and soil moisture indicators.
Midwest
Increasing short-term precipitation deficits and declining soil moisture supported an expansion of abnormal dryness (D0) across Ohio, Indiana, and Illinois. This increase in D0 coverage is consistent with 30 to 60-day SPI values. Moderate drought (D1) was also expanded across Illinois based on 30-day SPI along with streamflows along the Kankakee, Illinois, and Vermillion Rivers. A broad expansion of D1 was required throughout Kentucky due to a prolonged dry spell since August. This D1 coverage is consistent with 60-day SPI and is also supported by NASA SPoRT soil moisture. According to the Paducah National Weather Service Office, Paducah had its driest August 1 – October 11 on record with only 2.12 inches of precipitation. Multiple reports from the following counties in Kentucky (Livingston, Fulton, Webster, Marion, Carlisle, Trigg, and Ballard) indicate poor pastures and low ponds. In addition, low flows persist along the lower Ohio River. 30 to 120-day SPIs supported 1-category degradations throughout much of the southern two-thirds of Missouri along with parts of Iowa. The extreme drought (D3) expansion in northwestern Iowa was based on longer-term SPIs and very low soil moisture percentiles. South of Lake Superior, severe drought (D2) was expanded due to a very dry summer and 120-day SPI. D0 and D1 was increased across northeastern and western Wisconsin based on SPIs at various time scales.
High Plains
30 to 120-day SPI along with soil moisture indicators supported expansion of moderate drought (D1) throughout northern and eastern North Dakota. Based on a consensus of indicators, severe drought (D2) was added to central North Dakota. Severe (D2) to extreme (D3) drought was expanded slightly across east-central Nebraska based on SPI at multiple time scales and soil moisture. Likewise, these indicators supported a 1-category degradation in parts of south-central and southwestern South Dakota. Impact reports from these areas of South Dakota include: zero soil moisture down to three feet on several fields and low stock ponds. The most widespread degradations made to Kansas were in northeast and east-central parts of the state, consistent with 90 to 120-day SPEI along with soil moisture indicators. An expansion of abnormal dryness (D0) and moderate drought (D1) was made to southeastern Colorado, based on 30-day SPIs, declining soil moisture and streamflows, and very dry VegDRI. Conversely, heavy rainfall (1 to 2 inches) since the beginning of October prompted a 1-category improvement for parts of southwestern Colorado. Slight improvements were justified across northwestern Wyoming, due to positive values of 30 to 90-day SPI and favorable soil moisture response from recent precipitation.
West
Increasing 90-day precipitation deficits of more than 6 inches and above-normal temperatures during September resulted in the continued expansion of moderate drought (D1) across western Washington and northwest Oregon. SPI values, soil moisture indicators, and 28-day streamflows strongly support D1 in these areas. According to the NCEI statewide rankings, Montana had its warmest July-August-September on record. Based on the 90-day SPEI along with 24-month SPI, extreme drought (D3) was expanded across northern Montana. D3 was eliminated in parts of eastern Montana due to the lack of support from SPI and SPEI values at various time scales. Based on longer-term SPIs and local feedback, 1-category improvements were made to parts of Utah along with bordering northeast Nevada.
Caribbean
No changes were made to Puerto Rico this week.
September 2022 was significantly wetter than normal across St. John, St. Croix, and St. Thomas. Windswept Beach on St. John reported 11.56 inches of rain this past month, their wettest September since Hurricane Irma moved through the region in 2017. St. Croix also recorded nearly a foot of rain (11.41 inches), which is almost twice the normal amount. King Airport on St Thomas reported 7.41 inches of rain, over 1.5 inches above normal. Despite significant dryness impacting these islands earlier this year, St. Croix has now received over 3 inches more than normal rainfall for the year to date, and St. Thomas is only about 1.5 inches below normal for the year (nearly 95 percent of normal).
Precipitation has been less generous so far this October. Through the eleventh, rainfall totals are 0.5 inch at St. Thomas (about one-third normal), 1.08 inches at St. Croix (about two-thirds normal), and 1.23 inches at St. John. But these amounts have had little or no effect on conditions across the Virgin Islands due to heavy rains during the prior few months. As a result, Drought Monitor designations remain unchanged this week, with no dryness or drought indicated except on St. Croix, where dryness had been more intense than at the other two sites before the last several months of increased rainfall.
Pacific
No changes were made to Alaska this week.
A light wind pattern across the central tropical Pacific resulted in locally heavy rainfall and easing drought conditions for Hawaii. Based on NDVI data, a 1-category improvement was made to Niihau. The northeast-facing slopes of eastern and western Maui continued to receive increased rainfall which has improved streamflows, supporting a 1-category improvement. On the Big Island, periods of afternoon heavy rainfall resulted in improving conditions over the South Kohala District and along the lower northeast-facing slopes.
Koror in Palau experienced a very dry September 2022, with 5.26 inches reported, it was their driest month since 4.66 inches fell March 2020. October has started out slightly better. During Oct 1-11, 3.30 inches of rain fell, which is below the normal of 4.66 inches for the period, but sufficient for water usage to meet demand if rain continues to fall at the current pace. Earlier, ample rainfall was recorded December 2021 – August 2022 (10 to 24 inches each month) so the region remains free of dryness and drought at this time.
In addition, the Marianas Islands remain free of dryness and drought. The islands had a multi-month spell with below-optimal rainfall (December 2021 – June 2022), but amounts increased over the last 3 months. In Guam, September brought 13.74 inches of rain, which was their wettest month since October 2021. In addition, generally 4 to nearly 7 inches has fallen on the archipelago during October 1-11, which is at a rate sufficient to keep pace with demand.
In western Micronesia, short-term abnormal dryness remains in place at Ulithi, but conditions at Yap have improved, so the abnormal dryness designation was terminated there. September 2022 brought slightly sub-optimal rainfall to both locations (between 7 and 8 inches). This was the fourth month of the past five with sub-optimal totals in Ulithi, and the second consecutive month with less than 2/3 normal at both sites. But the first 12 days of October brought over 8 inches of rain to Yap, which is more than fell during the whole month of September. This is more than sufficient to keep up with water usage. significant impacts have not been reported at Ulithi despite continued subnormal rainfall.
In the stripe of islands from north-central through eastern Micronesia, dryness and drought are absent in Woleai, Chuuk Lagoon, Pohnpei, Pingelap, and Kosrae. Near to above-normal rainfall was observed during September 2022 throughout this region, with totals ranging from 10.26 inches at Woleai to 18.6 inches in Kosrae. October has started off with near- to above-rainfall at a rate that will keep up with water demand. Since March 2022, only one month at one site received below optimal rainfall, barely (7.93 inches at Chuuk in June 2022).
Below-normal rainfall has been more prevalent across parts of central and southern Micronesia. In central parts of this region, rainfall has been abundant in Nukuoro. Between 11 and 25 inches fell during each of the last 7 months, including 12.22 inches in September 2022. October 2022 has been considerably drier, with only 1.21 inches falling through the eleventh, but the prior months of abundant rain are keeping any dryness impacts at bay. Meanwhile, drought has been a factor both north and south of Nukuoro.
To the north, 4 of the past 5 months brought sub-optimal rainfall to Lukunor, and the 3.7 inches measured in September was the lowest monthly total since February 2020. For both August and September, less than 36 percent of the normal monthly total was reported. During Oct 1-11, rainfall increased slightly here, but remains well below normal and below the amount generally needed to keep up with demand. So far, October rainfall has totaled 1.98 inches; at this pace, October would be wetter than September, but not by much. The lack of rainfall has reduced water catchment levels. Short-term moderate drought is identified there.
To the south of Nukuoro, drought has intensified again across Kapingamarangi. Drought has waxed and waned over the past several years and is now waxing again. Four of the past five months brought under 45 percent of normal rainfall, and only July 2022 brought enough rain to keep up with demand. According to local reports, water catchment levels were around half of normal, and crops were starting to deteriorate. Rainfall totals remained well below normal for the first 11 days of October, with only 0.58 inch falling. Kapingamarangi remains in severe drought, with both long-term and short-term impacts.
Abnormal dryness ended in Wotje, which leaves all reporting locations in the Marshall Islands free of dryness and drought. For September, the nation was sharply divided, with three sites reporting abundant rainfall, and three others reporting sub-optimal totals. Ailinglapalap, Majuro, and Mili recorded 14.89, 17.72, and 19.08 inches, respectively. Meanwhile, September 2022 dropped 7.34 inches on Kwajalein, 6.07 inches on Jaluit, and 6.61 inches at Wotje. The latter site has the driest climatology of all monitored U.S.-affiliated Pacific islands, and is more drought-prone than the other locations. Wotje recorded 1.75 inches during the first 11 days of October, which is somewhat below-normal and sub-optimal; however, recent rainfall has been sufficient to minimize dryness-related impacts, so Wotje remains out of drought and dryness for the time being.
In both Kwajalein and Jaluit, most months since March 2022 brought above-optimal rainfall amounts, so no abnormal dryness is introduced at this time. October 1-11 brought 6.35 inches of rain to Kwajalein, ending any concerns from the dry September.
In the Southern Hemisphere, American Samoa remained in moderate drought this week. Only 3.92 inches fell in Pago Pago in September 2022, exacerbating periodic subnormal rainfall dating back several months. October 1-11 dropped just over 2 inches of rain on Pago Pago, on pace to almost double September rainfall by the end of October. But this short period of increased rainfall has not alleviated water supply concerns. A local Atwater division was forced to shut down one water well, which has dried out. Water conservation and requests for voluntary usage reductions are being encouraged.
Looking Ahead
From October 13 to 17, a series of cold fronts are forecast to progress southeastward across the central and eastern U.S. The heaviest precipitation (more than one inch), through Oct 17, is forecast across the Northeast and also extending from the lower Mississippi Valley west to New Mexico. Mostly dry weather is likely to persist across the north-central U.S. and Pacific Northwest. Above-normal temperatures are forecast to continue throughout the northwestern quarter of the U.S., while below-normal temperatures expand from the northern Plains to the Corn Belt and Ohio Valley.
Spanish The Climate Prediction Center’s 6-10 day outlook (valid October 18-23, 2022) strongly favors below-normal temperatures across the eastern and south-central U.S. with a persistence of above-normal temperatures over the West. A majority of the contiguous U.S. is likely to experience drier-than-normal conditions with the largest probabilities (50 percent) for below-normal precipitation forecast across the north-central Great Plains. Elevated probabilities for above-normal precipitation are limited to the Southwest.
Author(s):
Brad Pugh, NOAA/CPC
Richard Tinker, NOAA/NWS/NCEP/CPC
Dryness Categories
D0 Abnormally Dry—used for areas showing dryness but not yet in drought, or for areas recovering from drought.
Drought Intensity Categories
D1 Moderate Drought
D2 Severe Drought
D3 Extreme Drought
D4 Exceptional Drought
Drought or Dryness Types
S Short-term, typically less than 6 months (agriculture, grasslands)
L Long-term, typically more than 6 months (hydrology, ecology)
SL Area contains both short- and long-term impacts
Source: National Drought Mitigation Center

