


California and National Drought Summary for March 7, 2023
Summary
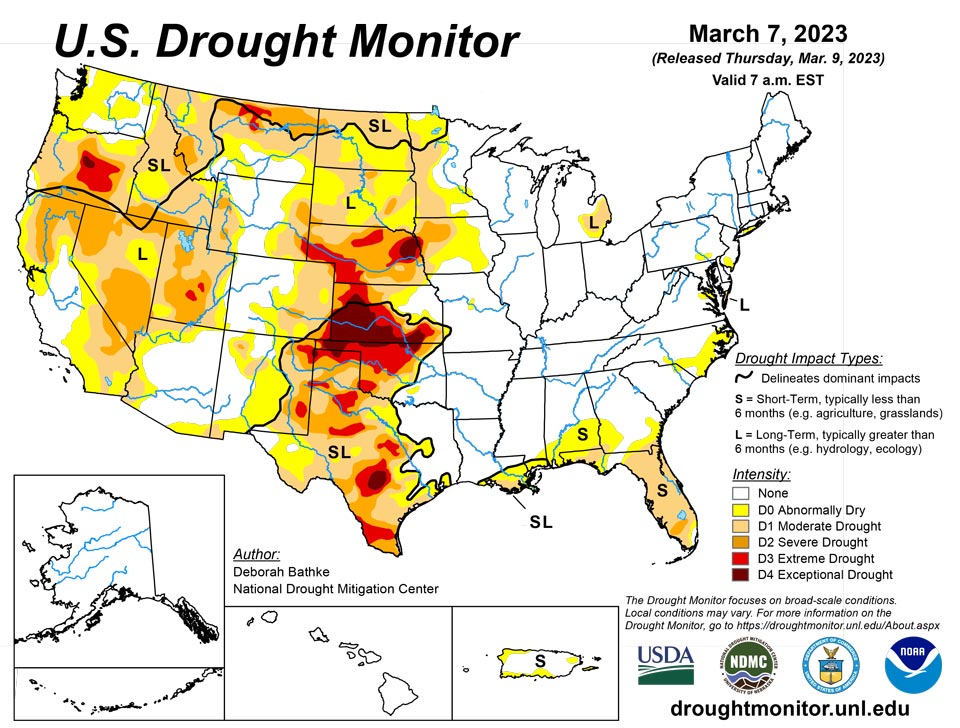
March 9, 2023 - A series of severe weather events moved across the South and Southeast this week, bringing damaging winds, tornados and heavy rainfall. As these storms moved through the Midwest, many locations experienced record daily rainfall. This same storm brought snow to the upper Great Lakes and parts of the Northeast. Precipitation was scarce across other areas of the country, including parts of the West, the High Plains and Deep South. Drought and dryness expanded in parts of the Pacific Northwest, southern Texas and the Gulf and Atlantic coasts. Drought improvements were seen across the West from prior weeks’ precipitation events. In addition, parts of the southern Plains, Great Lakes and mid-Northeast regions also saw improvements.
Northeast
Last week’s precipitation reduced the remaining abnormally dry (D0) conditions in the Great Lakes region of New York and along the border of Pennsylvania, Maryland and West Virginia, where precipitation deficits and soil moisture have shown recovery. Spots of abnormal dryness remain in Long Island, southeast Pennsylvania and South Jersey.
Southeast
Storms brought high winds, tornadoes and heavy rain to parts of the Southeast. A band of heavy rainfall (about 2 to 5 inches) fell north of the region’s drought areas. The areas where abnormal dryness (D0) and drought expanded generally saw less than a quarter inch of rain. Severe drought (D2) was introduced in south Florida where rainfall has been less than 25 percent of normal (deficits of 4 to 6 inches) over the last 90 days. Streamflow values are also below normal, satellite derived soil moisture is low, fire danger is extremely high (as indicated by the Keetch Byram Drought Index) and burn bans are in effect. Moderate drought (D1) expanded in the northeast, central west, and northwest parts of Florida, as well as in southwest Georgia. There, rainfall totals generally range from 25 to 75 percent of normal (deficits of about 3 to 5 inches) over the last 90 days. These areas also show declining streamflow values and dry soils. Abnormal dryness (D0) developed along the edges of this drought area and was introduced in parts of North and South Carolina. Short-term rainfall deficits combined with mean temperatures of 10 to 12 degrees above normal over the last month have resulted in very dry conditions.
South
Storms brought high winds, tornadoes and heavy rain to parts of the South. A band of heavy rain, over 300 percent of normal (over the last 7 days), fell over drought areas in north-central and central Texas. But, because precipitation is low in Texas this time of year, totals ranged from about 0.5 to 1 inch and provided minimal relief to areas in moderate (D1), severe (D2) and extreme (D3) drought. Longer term deficits remain, and streamflow values quickly returned to below normal over much of the region. Otherwise, most of Texas received little to no rainfall, and many locations experienced an expansion of drought conditions. In the Panhandle, D3 expanded slightly. Precipitation there is less than 25 percent of normal over the last 30 days, and satellite derived soil moisture is very low (5th percentile or less). In South and West Texas, all drought levels expanded as the dry pattern continued. Precipitation in these areas has been less than 10 percent of normal over the last 30 days. The dry weather, combined with temperatures of 3 to 6 degrees above normal, has dried out soils and increased fire danger (as indicated by the Keetch Byram Drought Index). CoCoRaHS observers in South Texas note the lack of measurable rain, cracks in the soil and plants with discoloration and delayed growth. In Oklahoma, 5 to 10 inches of rain fell last week (300% of normal) over the state’s eastern drought boundary. Repeated bouts of moisture have led to short-term improvements overwhelming longer-term deficits, resulting in 1-category improvements. The state climatologist for Oklahoma noted that over half of the reservoirs in the southeast part of the state are now over their conservation pool or close to normal. Meanwhile, short- and long-term drought still have a grip on the northwest part of the state. Dry conditions combined with above normal temperatures and high winds have resulted in several fires.
Midwest
The Midwest continued to get soaked with rain and snow this week as a storm moved through the region. Improvements were made to moderate (D1) and severe (D2) drought in Michigan where precipitation deficits, soil moisture, and streamflow show recovery. This precipitation also erased lingering dryness in Indiana, which is now out of drought or dryness for the first time since May 17, 2022.
High Plains
Much of the High Plains remains in long-term drought, with the central High Plains seeing some expansion of moderate drought (D1) from southeast Nebraska to northeastern Kansas based on continued lack of recent precipitation, low streamflows and soil moisture. In the Colorado Rockies, abnormal dryness (D0) was slightly expanded based on below-normal precipitation. In south-central Colorado, abnormal dryness (D0) was expanded because of continued lack of precipitation and low soil moisture. However, southeast Kansas received heavy rain from severe storms that extended from the South and Southeast into the Great Lakes regions. The northern High Plains also saw improvements in north-central/northeastern Nebraska and southeastern North Dakota in response to the season’s heavy snows. Soils are still frozen, so the full benefits of the season’s precipitation will not be realized until the soils thaw and the snow meltwater soaks into the ground. Wyoming also saw improvements to moderate drought (D1) where precipitation deficits have recovered.
West
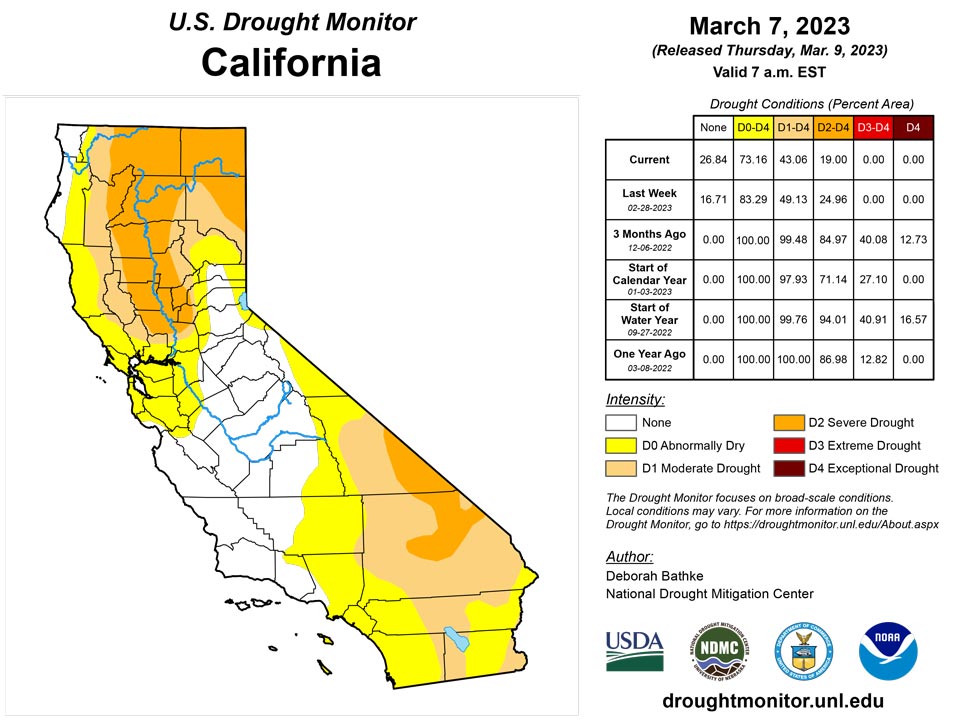
This week, additional rounds of rain and snow added to the ample precipitation received across the West since December 2022. Continued analysis of the effects of the season’s moisture resulted in continued improvements to long-term drought conditions in many parts in the West. California saw improvements to severe (D2) and moderate (D1) drought, as well as abnormal dryness (D0) along the central coast and in the San Joaquin Valley and southern California. National Weather Service offices in the area report extremely wet conditions. Water-year-to-date (WYTD) precipitation is 150% of normal or higher, and nearly every indicator shows improvement with all but the longest timescales (24-to-36-month precipitation) showing above-normal conditions. Similarly, the season’s precipitation chipped away at long-term drought areas in southern Nevada (D2 and D3), parts of Utah (D2 and D3) and western New Mexico (D1, D2 and D3). Precipitation deficits, soil moisture and streamflow show recovery. Groundwater levels and reservoir storage, which takes longer to recover, however, remain low. Precipitation in the Pacific Northwest helped improve severe drought (D1) in western Idaho and abnormal dryness (D0) in southwest Montana. Precipitation indicators in these areas are wet out to 12 months. In the rest of the Northwest, recent precipitation wasn’t enough to warrant improvement. Moderate drought (D1) expanded in north central and northeast Oregon where WYTD precipitation, streamflow and soil moisture is low. The Oregon state climatologist notes that “This water year has been surprisingly dry across the state despite the near-normal snowpack. Approximately 70% of the state only has 75% of normal WYTD precipitation, and about 25% is below 50% of average.” In Montana, severe drought (D2) expanded in response to low snow accumulations and its effect on streamflow and soil moisture.
Caribbean
In Puerto Rico, abnormal dryness (D0) expanded over the northwest and eastern parts of the island based on rainfall deficits out to 90 days, low streamflow values and impact reports from local experts. D0 was also added to the island of Culebura.
Moderate short-term drought persisted on St. Thomas and St. Croix this week while St. John again has no dryness designation. During December 1, 2022 – March 6, 2023, both St. Thomas and St. Croix reported less than half of normal rainfall (about 47 percent at both sites). But other considerations have tempered the impact of these well below normal totals. There were some problems with the rainfall recording gauge, so St. Thomas totals may be a little underestimated. And on St. Croix, December accounts for most of the accumulated deficit through March 6. A total of 2.7 inches of rain has fallen there so far this calendar year, which is about 75 percent of normal.
St. John has been unfavorably dry for the past 4 weeks. February 6 – March 6 brought just over 1.1 inches of rain, compared to the normal of just over 2 inches (56 percent of normal). But January was much wetter than at the other 2 locations. Almost 4.7 inches of rain was reported while only 1.2 to 1.9 inches fell on the other sites. Prior to the current short-term dryness, the first 36 days of the calendar year brought 5.5 inches of rain to St. John (almost 170 percent of normal), and 8.4 inches of rain fell for the full period since December 2022, which is only marginally below normal (over 90 percent). St. Croix and St. Thomas measured less than half of normal for the same period.
Pacific
In Alaska, no changes were made to the map this week. The state remains free of drought and abnormal dryness.
In Hawaii, no changes were made to the map this week. The state remains free of drought and abnormal dryness.
In Palau, Koror was considerably drier the past few weeks than during the prior several months, but February still brought over the 8 inches that generally allows recharge to keep pace with demand. Dryness-related impacts are absent, and are not expected to develop in the near future.
February and early March brought subnormal rainfall to the Marianas. February monthly totals generally ranged from 3 to 6.5 inches. This is considerably below the amount necessary for recharge to keep pace with water demand, and several months ago, November 2022 was even a little drier. But the unfavorably dry February followed a January with deluging rainfall. The recording sites reported 11.0 to 15.5 inches for January 2023, which was near or over 3 times the normal, and well over the 8-inch benchmark. Conditions will need to be monitored closely here, as several more weeks of dry weather may start to raise concerns about dryness impacts; however, because of the exceptionally wet January, no problems have arisen at this time.
January 2023 was generally wet across Federated States of Micronesia (FSM), but similar to conditions in the Marianas, conditions have dried out since then. Of 18 reliably reporting sites across FSM, 13 reported February totals short of the amount necessary to keep pace with demand (8 inches). In January, only 2 of those locations recorded less than 8 inches. Not all sites have drier out the past 5 weeks - Chuuk Lagoon, Pohnpei, Kosrae, and Nukuoro in central and eastern FSM reported 14.0 to 24.5 inches of rain in February 2023. Dryness-related impacts are absent from these locations, and none are expected in the foreseeable future.
But other locations across FSM experienced considerably less rainfall. In roughly the western half of the country, most sites reported only 4 to 7 inches for February 2023. Lukunor, Woleai, Pingelap, and Yap received 6 to 7 inches, and Ulithi reported just under 3.9 inches. These totals are sub-optimal, but this is the driest time of year across most of FSM, and most of these amounts were near or above normal. Only Lukunor and Pingelap were significantly below normal, at about 60 percent of average.
Ulithi may be on the cusp of D0 conditions, with 5 of the last 7 months bringing sub-optimal rainfall (<8 inches), but the other 2 months were well over the preferred amount (October 2022 = 16.7 inches; January 2023 = 14 inches), staying impactful dryness for the time being.
The wet January and after several months of adequate rainfall kept impactful dryness at bay in most locations, with the notable exceptions of Lukunor and Pingelap in east-central FSM. D0s conditions were identified for both of these sites, essentially unchanged for the past few weeks. Prior to a wet January at Lukunor, there were 7 consecutive months with sub-optimum rainfall amounts. For Jun-Dec 2022, rainfall averaged 7.3 inches per month (slightly below the optimum), compared to a normal of 12.2 inches per month (well above optimum). Meanwhile, January 2023 in Pingelap was the driest month since March 2020, and February 2023 was the 3rd-driest month during that same stretch. The Jan - Feb 2023 total of 11.7” was the lowest since Dec 2019 – Jan 2020 (9.4 inches). But impacts from this acute short-term dryness are muted because rainfall was abundant during Jul – Nov 2022, when monthly totals ranged from 13.5 to 21.8 inches.
In southern sections of FSM, dryness is intensifying across Kapingamarangi, which has been plagued by periods of serious drought for the past several years. During January 2023, 15.2 inches of rain fell, making it the wettest month since May 2021; however, well below normal rainfall was recorded for February 2023 (4.4 inches, or about 43 percent of normal). And even with over 15 inches of rain in January, average monthly rainfall for the most recent 12 months (through February 2023) was only 5.8 inches. This is only 55 percent of the normal for the period (10.7 inches per month) and just 72 percent of the monthly total that would allow recharge to keep up with demand (8 inches per month). In addition, the frequent droughts that have plagued the island for the past several years has left the region more vulnerable to the dryness than would normally be the cast. Taking all this into account, Kapingamarangi deteriorated from abnormal dryness (D0l) last week to moderate drought (D1sl) this week.
Following the pattern observed across most of the U.S. Affiliated islands, most of the Marshall Islands reported notably less rainfall in February 2023 than in January. As a result, moderate short-term drought persisted at Kwajalein and Wotje (D1s), and both Jaluit and Ailinglapalap may be approaching D0 conditions..
In Kwajalein, about 1.3 inches of rain fell in February, which is only 40 percent of normal and the driest month there since January 2022. The December 2022 – February 2023 rainfall total of 14.3 inches is only marginally below normal, but is well below the optimum amount needed for recharge to keep pace with demand. The climatology starts to get wetter in April, and if moisture deficits persist into April and beyond, conditions could begin to deteriorate more rapidly.
Wotje is more vulnerable to drought than most of the other U.S. Affiliated Islands because it is the driest climatologically, with an annual average rainfall of 58.8 inches (the next driest location on the map is Saipan, which averages just shy of 70 inches). So rainfall at Wotje frequently falls short of the optimum 8 inches per month. For 6 of the past 7 months, rainfall totals were below 8 inches, raising concerns about impactful dryness even though the 7-month total was only slightly below normal. February totals were about the same as those at Kwajalein, just 1.3 inches. This was the driest month since last February, when the first 2 months of 2022 saw only 0.05 inch fall.
Ailinglapalap reported 15.7 inches of rain December 2022 – February 2023, compared to a normal over 20 inches. Rainfall during both December and February was below the preferred amount of 8 inches, and January was only marginally wetter (8.2 inches). However, the prior 9 months were exceedingly wet. The mean monthly rainfall was 16.5 inches (148.5 inches total), compared to the normal monthly average of 10.3 inches (92.4 inches total). This prolonged period of surplus rain is probably the main reason than no dryness impacts have been reported so far, keeping the location out of D0, but that could change if the short-term dryness persists much longer.
Jaluit is another location that appears to be approaching D0, but for which no designation has been introduced at this time. 3 of the last 4 months, and 5 of the last 7, were drier than what is necessary for recharge to keep up with demand, and with 8.3 inches January was barely above the threshold. Rainfall for the last 10 months totals was more than 20 inches below normal, but monthly average for this period was still above the optimum threshold, at 8.2 inches. For this reason, no dryness designation is introduced at this time.
Pago Pago reported 13.2 inches of rain in February, on top of 15.2 inches in January. In addition, monthly totals for the last 3 months of 2022 ranged from 9.1 to 13.8 inches. Dryness-related impacts are not a concern at this time, and likely won’t be in the near future.
Looking Ahead
The National Weather Service Weather Prediction Center forecast for the remainder of the week (valid March 8 – March 11) calls for an atmospheric river to bring heavy rainfall, flooding and high-elevation snow to the West Coast. A winter storm tracking across the central High Plains and upper Midwest is also expected to bring snow to these regions, with the heaviest amounts in southern Minnesota, northern Iowa and southern Wisconsin. As this storm moves eastward, mixed precipitation is likely in a band stretching from eastern Nebraska to southern New York. Heavy rain and thunderstorms are expected across the southern Plains, the South, lower Midwest and the Southeast.
Moving into next week, the Climate Prediction Center’s 6-to-10-day outlook (March 13 – March 17) calls for above-normal temperatures across the Southwest with below-normal temperatures across much of the Lower 48 and Alaska. Most of the U.S. can expect near- to slightly above-normal precipitation. Parts of the Midwest and Northeast are the only areas with slightly increased odds for below-normal precipitation.
Author(s):
Deborah Bathke, National Drought Mitigation Center
Richard Tinker, NOAA/NWS/NCEP/CPC
Dryness Categories
D0 Abnormally Dry—used for areas showing dryness but not yet in drought, or for areas recovering from drought.
Drought Intensity Categories
D1 Moderate Drought
D2 Severe Drought
D3 Extreme Drought
D4 Exceptional Drought
Drought or Dryness Types
S Short-term, typically less than 6 months (agriculture, grasslands)
L Long-term, typically more than 6 months (hydrology, ecology)
SL Area contains both short- and long-term impacts
Source: National Drought Mitigation Center

