


March 10, 2023 - By Emily Becker - La Niña—the cool phase of the El Niño-Southern Oscillation (ENSO) climate pattern—has left the building! After a year and half of non-stop La Niña, the tropical Pacific ocean-atmosphere system has transitioned to neutral, allowing NOAA to issue its “Final La Niña Advisory”. What can we expect for ENSO through the summer and into next fall and winter? I’ll get to that!
Get outta town
First, though, let’s bid La Niña adieu. The most recent weekly measurement of the sea surface temperature in the Niño-3.4 region (our primary monitoring region for La Niña and El Niño) was a mere -0.2°C (-0.4˚ F) compared to the long-term average. (To calculate a change in temperature in degrees Celsius to Fahrenheit, multiply by 1.8.) Also, the latest monthly value from the OISSTv2.1 dataset was -0.4°C (-0.7˚ F) for this same region. The threshold for La Niña is cooler than -0.5 °C, so we can say the ocean surface has moved away from La Niña.
Sea surface temperatures in the tropical Pacific Ocean from early January through early March 2023 compared to the long-term average. East of the International Dateline (180˚), waters remained cooler than average, a sign of La Niña. Graphic by Climate.gov, based on data from NOAA’s Environmental Visualization Lab. Description of historical baseline period.
The atmosphere is a little more complicated, as it tends to be! We still see some indications of a La Niña-like strengthened Walker circulation, with more rain and clouds than average over Indonesia, less over the central Pacific, and enhanced trade winds. However, without the cooler sea surface characteristic of La Niña, it’s likely this pattern will diminish in the coming weeks.
One measure of the atmospheric component of ENSO is the Equatorial Southern Oscillation Index (EQSOI), which measures the relationship between surface air pressure in the western and eastern Pacific. When this index is positive, it indicates that the Walker circulation is amped up. In February, after nearly a year at or above 1.0, the EQSOI was just 0.1 This tells us that at least one element of the atmospheric La Niña response has weakened.
We’re often going on and on here at the ENSO Blog about how ENSO is a seasonal phenomenon, meaning the ocean and atmosphere criteria must be met for several consecutive months in order to qualify as La Niña or El Niño. The same is not true for neutral conditions, however. Once the tropical Pacific ocean-atmosphere system is showing signs of decoupling, such as a monthly Niño-3.4 index value warmer than -0.5 °C, we can say that neutral conditions have likely arrived.
Spring breakers
The forecaster consensus is indeed very confident that neutral conditions will remain through the spring. We know what you’re really interested in, though—will El Niño develop? If we can anticipate an El Niño, we can anticipate an increased likelihood of its impacts on weather and climate. In contrast, a continuation of neutral conditions means the tropical Pacific Ocean will not be an actor on the world’s climate stage. The lack of El Niño or La Niña means that there is no seasonal-scale influence from the Pacific to push around the global atmospheric circulation and influence seasonal climate patterns.
Many of our computer climate models are predicting a transition into El Niño sometime later this year. However, right now is a very tricky time of year for the models, due to the “spring predictability barrier.” ENSO events peak in the winter and tend to decay and transition in the spring, so models often don’t have a lot of strong signals to go on. (Why do ENSO events peak in the winter?? This is a really complicated topic that we don’t have a simple, satisfactory answer to… (yet!)
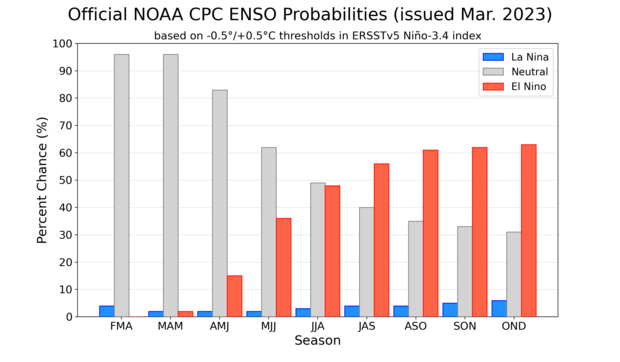
NOAA Climate Prediction Center forecast for each of the three possible ENSO categories for the next 8 overlapping 3-month seasons. Blue bars show the chances of La Niña, gray bars the chances for neutral, and red bars the chances for El Niño. Graph by Michelle L'Heureux.
Our forecaster consensus does reflect the increased chance of El Niño, with chances around 60% by the fall. However, the spring predictability barrier, together with the still somewhat-La Niña-ish atmosphere and the lack of strong physical signs such as a large amount of warmer-than-average subsurface water in the tropical Pacific, mean we’re not yet hoisting an El Niño Watch.
One fun little nugget of information is that, in our historical record dating back to 1950, we have not gone more than four years in a row without an El Niño. If we don’t have an El Niño in 2023–24, that will be five years! However, 73 years is a short record for a phenomenon that has decade-to-decade variability, so this is more of an interesting factoid than anything.
Meanwhile, in Peru
In the sea surface temperature animation above, you might notice a red patch growing off the coast of Peru in recent weeks. ENFEN (Peru’s commission on ENSO) recently issued a notice about the potential for a Coastal El Niño, an event which can have very significant consequences for rainfall in Peru. Coastal El Niño events can also spread west, preceding El Niño conditions in the Niño-3.4 region, so it’s something to keep an eye on. For more on the relationship between Coastal and larger-scale El Niño, check out this conversation between Michelle and friend-of-the-Blog Ken Takahashi back in 2017 (during the last coastal El Niño event), and Ken’s post about extreme El Niños.
I reached out to Ken about current events, and he pointed out that the Madden-Julian Oscillation, an area of increased storms that travels eastward around the equator over the course of one to two months, is in a phase that directly impacts Peru. Taken with the warm ocean surface, this is “a dangerous combination that may result in even heavier rainfall than what has already started to fall onto the northern coast of Peru,” he said.
Around-the-world cruise
As I mentioned above, the reason we care so much about El Niño and La Niña is that they can often be predicted months in advance, meaning we can get an early idea of some of our potential seasonal climate conditions. For example, the southeast coast of Africa tends to be cooler and wetter than average in December–February during La Niña.
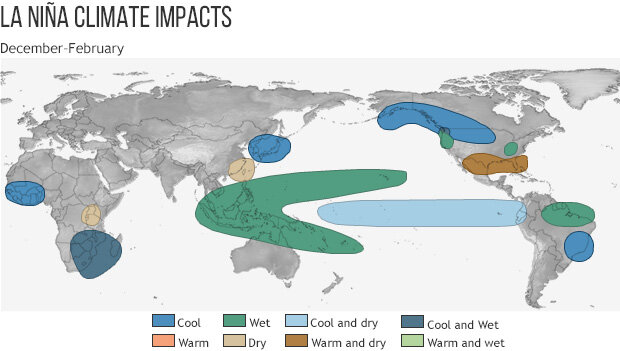
December-February climate patterns that are common during La Niña. NOAA Climate.gov map, adapted from original by the Climate Prediction Center.
Now that this La Niña has concluded, let’s take a look at how the December–February rain/snow and temperature patterns shook out around the world. In a couple of weeks, Tom will get into the winter weather in the United States, so stay tuned for a closer look there.
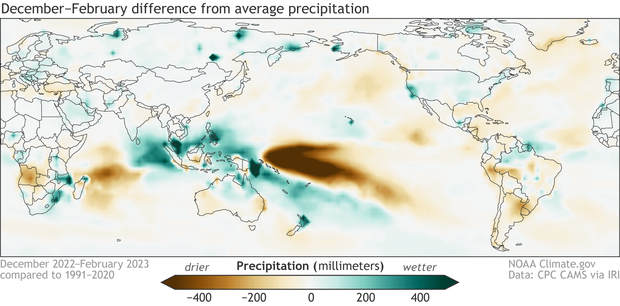
Global rain and snow patterns during December–February 2022–23, shown as the departure from the long-term (1991–2020) average. Brown colors indicate drier-than-average and green indicate wetter-tnan-average conditions. Climate.gov figure from CPC CAMS data, obtained from the IRI Data Library.
The first thing that jumps out here is the increased rain through the Maritime continent and northern Australia, and the dry region in the central Pacific, both expected La Niña impacts. Many of the more remote impacts that are common with La Niña, including increased rainfall in southeastern Africa and northeastern South America, and drier conditions around Uruguay, are also apparent here.
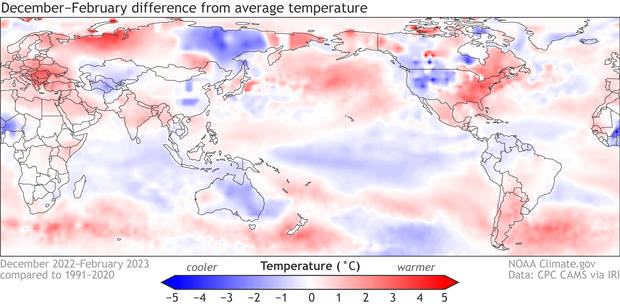
Global temperature patterns during December–February 2022–23. Temperature is shown as the departure from the long-term (1991–2020) average. Red indicates warmer-than-average and blue indicates cooler-than-average conditions. Climate.gov figure from CPC CAMS data, obtained from the IRI Data Library.
La Niña is linked to some cooler-than-average global impacts, including in western Africa, eastern Brazil, and eastern Asia. We don’t expect every ENSO impact to show up every winter—with random weather variations and the influence of climate change, ENSO is hardly the only player on the field—but overall, it’s not surprising that the December–February global patterns resemble the La Niña impacts.
If you dropped in today to get the final chapter of the daily temperature investigation (see parts 1, 2, 3), I’m sorry—there was just too much to cover this month. With at least a few months of neutral conditions expected, I will wrap that up in coming posts. See you in April!
A blog about monitoring and forecasting El Niño, La Niña, and their impacts.
Disclaimer:
The ENSO blog is written, edited, and moderated by Michelle L’Heureux (NOAA Climate Prediction Center), Emily Becker (University of Miami/CIMAS), Nat Johnson (NOAA Geophysical Fluid Dynamics Laboratory), and Tom DiLiberto and Rebecca Lindsey (contractors to NOAA Climate Program Office), with periodic guest contributors.
Ideas and explanations found in these posts should be attributed to the ENSO blog team, and not to NOAA (the agency) itself. These are blog posts, not official agency communications; if you quote from these posts or from the comments section, you should attribute the quoted material to the blogger or commenter, not to NOAA, CPC, or Climate.gov.
Source: ENSO blog team

