


California and National Drought Summary for January 15, 2019
Summary
January 17, 2019 - A mixture of rain and snow accompanied a low pressure system from the Great Lakes to New England during early January. An upper-level low and its associated surface low tracked across the central and eastern U.S. from January 11 to 13. More than 4 inches of snow blanketed areas from Kansas east to the middle Mississippi Valley, Ohio Valley, and mid-Atlantic. Snowfall reports of up to 20 inches were reported from northern Missouri, while 8 to 13 inches of snow occurred in the Washington, D.C. metro area. Periods of onshore flow continued to affect the West Coast although precipitation generally averaged below normal across the Pacific Northwest during the past week. A vigorous upper-level low approached southern California on January 14, bringing heavy snow (6 to 12 inches) to elevations above 5,000 feet and locally heavy rain (more than 1 inch) from the Los Angeles area south to San Diego.
Northeast
Light to moderate precipitation fell across the Northeast this past week with weekly amounts averaging near to slightly above normal across northern New England. The heaviest amounts (more than 1 inch, liquid equivalent) were observed outside of the D0 areas in northern Vermont and northwest Maine. Although precipitation during the past 30 days and a lack of impacts would support removal of these lingering D0 areas, they were maintained due to poor 60 to 90-day SPI values.
Southeast
Little to no rainfall has occurred across southern Florida since the beginning of January while temperatures have averaged 3 to 6 degrees F above normal. 28-day USGS measurements on the Loxahatchee River near Jupiter, Florida are reporting a flow at only the 12th percentile. A severe drought area was added from near Melbourne south to Port St Lucie, Florida where precipitation deficits are in excess of 12 inches during the past 180 days. This newly introduced D2 area is also supported by negative SPI values at varying time ranges. The abnormal dryness (D0) area was expanded to include western Collier County given the increasing 90-day precipitation deficits. As of January 15, water levels in Lake Okeechobee were more than 2 feet below normal. Although it is a dry time of year, southern Florida will be closely monitored in subsequent weeks for further degradation. In contrast to southern Florida, the remainder of the Southeast Region remains excessively wet with 90-day precipitation surpluses of 4 to 12 inches and soil moisture ranking above the 90th percentile.
South
Widespread precipitation (more than 0.5 inch, locally more) was observed across the eastern two-thirds of Oklahoma, Arkansas, northern Louisiana, and eastern Texas. This precipitation maintained high soil moisture and streamflows throughout much of the southern Great Plains and lower Mississippi Valley. A slight reduction in the D0 and D1 areas was made to Cameron County in extreme southern Texas as more than 0.5 inch of rainfall occurred in the eastern part of that county. Persistent, dry weather along with periods of enhanced winds resulted in a slight expansion of abnormal dryness across the Texas Panhandle.
Midwest
Widespread precipitation (mostly moderate to heavy snow) occurred this past week from Missouri east to the Ohio Valley. Precipitation amounts exceeded 1 inch across southwest Missouri where precipitation surpluses of 2 to 4 inches, or more, were observed. Since precipitation has averaged close to average during the past 90 days, any lingering abnormal dryness was removed. A small area of abnormal dryness (D0) exists across northwestern Minnesota where the ground is frozen and snow-covered.
High Plains
A lack of snowfall this winter resulted in an increase in the coverage of abnormal dryness (D0) and moderate drought (D1) across parts of Wyoming. Basin snowpack is running below average in the Wind River Range and SPI values in western Wyoming are below -1 on timescales from 30-days to 6-months. Heavy precipitation (over 0.5 inch, liquid equivalent) for this time of year prompted a 1-category improvement to drought conditions over south-central to southeast Colorado, including the counties of Pueblo, Otero, and Bent. This past week’s precipitation is more than their monthly average for January. Crop reports from this region indicate that winter wheat was successfully planted. Although no additional improvements were made to southwest Colorado this week, the Sangre de Cristos and San Luis Valley will be reassessed next week.
Moderate to heavy snow (more than 0.5 inch, liquid equivalent) blanketed much of Kansas and southeast Nebraska. Snow also occurred across the Colorado Rockies and along the Front Range, but precipitation was generally lighter east across the high Plains. Despite mostly dry weather across the Dakotas this past week, no changes were made to the existing D0 and D1 areas since it is a relatively dry time of year and soils are frozen.
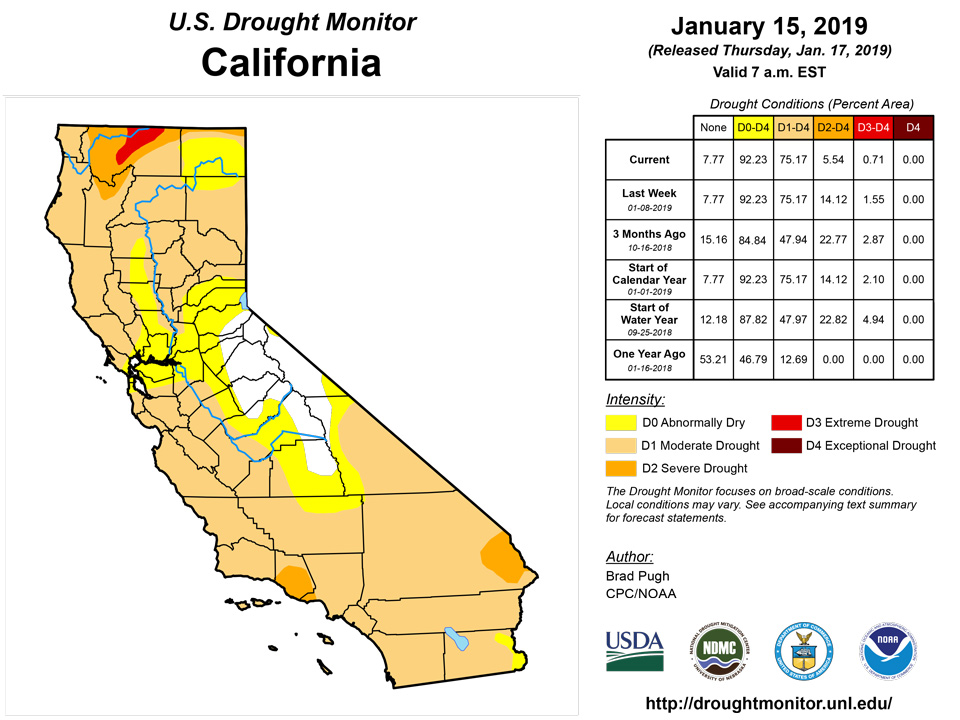
West
Locally heavy precipitation (more than 2 inches) fell across southern California for the second consecutive week. Precipitation amounts have ranged from 2 to 5 inches, liquid equivalent, during the past two weeks from Lompoc south to the Los Angeles area. 1 to 2 inches of precipitation has generally been observed from Los Angeles south to San
Diego during the past two weeks. The recent and ongoing heavy precipitation has triggered mud slides along burn-scarred hillsides. Based on near to above average precipitation during the 2018-19 water year to date, a continued increase in water storage on Lake Cachuma, and 12 to 24-month SPIs, the D3 area was upgraded to D2. Recent heavy precipitation and 12 to 24-month SPIs also support an upgrade from D2 to D1 across southern California. Additional improvement may be needed across southern California in next week’s USDM with heavy precipitation occurring after 7am EST on Tuesday.
Drought coverage and intensity remained steady this week across the Pacific Northwest. However, precipitation deficits of 5 to 10 inches exist for the water year to date (October 1, 2018 to January 15, 2019) across western Oregon and southwest Washington. Also, basin average snow water content is running below 60 percent of normal across the southern Cascades. Due to these factors, the Pacific Northwest will be closely monitored during the remainder of the 2018-19 water year.
Abnormal dryness (D0) was expanded across northwest Montana, Idaho, and western Wyoming where ACIS indicates that precipitation has averaged less than 50 percent of normal during the past 30 to 90 days. Soil moisture ranking percentiles are in the lowest 30th percentile across northwest Montana. Low snow levels this winter along with favorable ground water levels precluded a further expansion of D0 across the Snake River Plain. Although snow water content is running between 50 to 75 percent of normal across western Idaho, it is too early in the 2018-19 winter to expand coverage of moderate drought (D1). Central and eastern Montana remains snow-free as temperatures have averaged near 10 degrees F above normal during the past 30days. If a lack of snow cover persists, then abnormal dryness may be needed in later releases.
Beneficial rain and high-elevation snow continues to prompt minor improvements to the intensity of drought across New Mexico. Based on the latest indicators, moderate drought (D1) was reduced in Grant and Hidalgo counties in southwest New Mexico, while a slight decrease in severe drought (D2) was made to the southern Sangre de Cristo Mountains of northern New Mexico. Heavy precipitation (rain and high-elevation snow) shifted east to Arizona after 7am EST on Tuesday. This heavy precipitation may result in minor improvement in next week’s USDM, but 6- to 1- month percent of normal precipitation remains well below normal.
Alaska, Hawaii, and Puerto Rico
Precipitation averaged near to slightly below normal across the Alaska Panhandle during the second week of January. Since 6-month precipitation deficits remain in excess of 12 or 15 inches across the ongoing long-term drought areas of the southeast Alaska Panhandle, no improvements were made this past week.
Outgoing longwave radiation (OLR) anomalies indicate suppressed rainfall over Hawaii during the first ten days of January which is typical during an emerging El Nino. A large expansion of abnormal dryness (D0) and moderate drought (D1) was designated for parts of Hawaii during the previous week. A lack of rainfall along with strong winds during late December has resulted in poor pasture conditions across the lower elevations of the South Kohala District on the Big Island. Based on this impact report, moderate drought was degraded to severe drought.
Widespread showers occurred across Puerto Rico this past week with local amounts exceeding 2 inches in the northwest. This recent rainfall has improved 28-day streamflows. Due to the recent rainfall, a reduction of the D0 and D1 areas was necessary and modifications were based on the 60-day precipitation deficits.
Looking Ahead
During the next 5 days (January 17-21, 2019), a low pressure system is forecast to develop across the southern Great Plains and then track northeast to the Ohio Valley. This low pressure system is expected to become a strong coastal low near southern New England. A swath of moderate to heavy snow and freezing rain is likely to accompany the winter storm from the middle Mississippi Valley northeast to the northern mid-Atlantic and Northeast. Although mostly dry weather is forecast across ongoing drought areas of southern Texas, light rainfall is anticipated across southern Florida during the next five days. Widespread rain and high-elevation snow are forecast throughout the western U.S. through early next week with heavy snow likely across the Cascades, Sierra Nevada, and Rockies. In the wake of the central and eastern U.S. winter storm this weekend, arctic high pressure is forecast to shift south from Canada and bring the coldest temperatures so far this winter to the northern Great Plains, Midwest, and Northeast. Periods of rainfall are expected across the western Hawaiian Islands during the next five days.
The CPC 6-10 day extended range outlook (January 22-26, 2019) indicates enhanced odds for below normal temperatures across much of the eastern two-thirds of the continental U.S .along with the central Rockies, Great Basin, and Southwest. Above-normal precipitation is favored from the Mississippi Valley to the East Coast and also across the northern and central Great Plains. High odds for below-normal precipitation are forecast across the Pacific Northwest, Great Basin, and California. Above normal precipitation is favored throughout Alaska, while above normal temperatures are most likely across southern mainland Alaska and the Alaska Panhandle.
Author(s):
Brad Pugh, NOAA/CPC
Dryness Categories
D0 Abnormally Dry—used for areas showing dryness but not yet in drought, or for areas recovering from drought.
Drought Intensity Categories
D1 Moderate Drought
D2 Severe Drought
D3 Extreme Drought
D4 Exceptional Drought
Drought or Dryness Types
S Short-Term, typically less than 6 months (e.g. agricultural, grasslands)
L Long-Term, typically greater than 6 months (e.g. hydrologic, ecologic)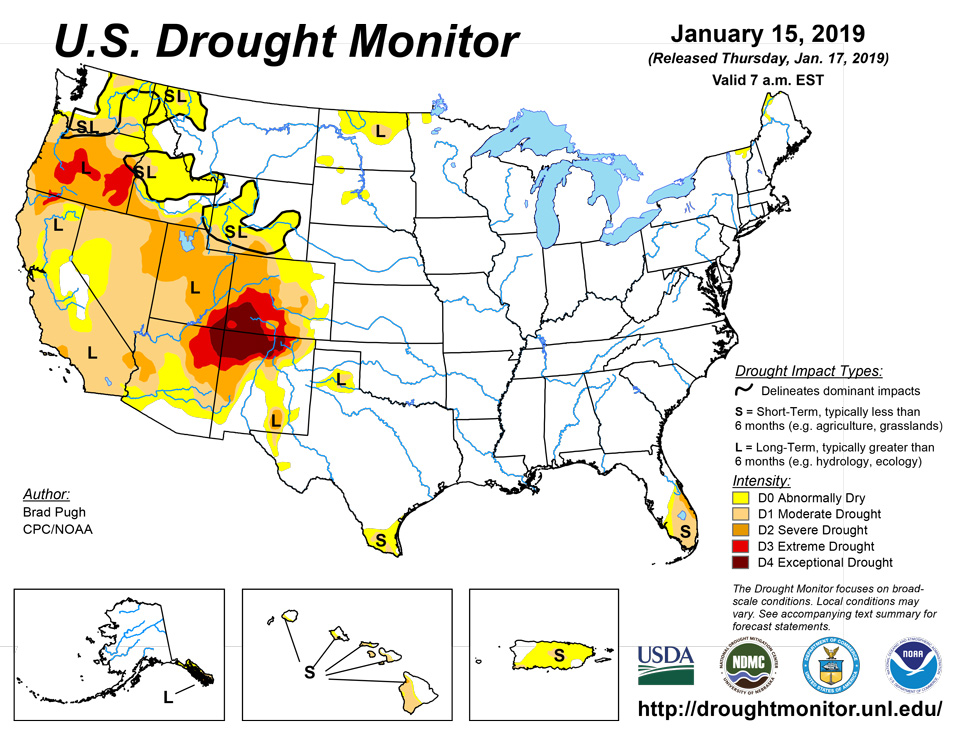
Source: National Drought Mitigation Center

