


April 15, 2019 - By Emily Becker - The Great Puny El Niño of 2018–19 continued through March, and forecasters predict it will likely remain through the summer and possibly continue into the fall. The tropical Pacific Ocean shows El Niño’s fingerprint clearly, with warmer-than-average sea surface temperatures stretching across the equator.
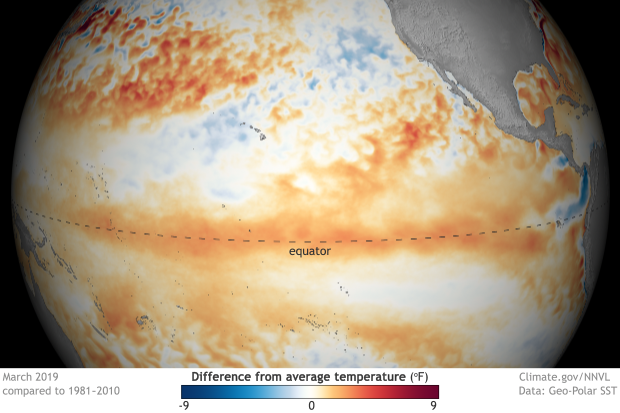
March 2019 sea surface temperature departure from the 1981-2010 average. Graphic by climate.gov; data from NOAA’s Environmental Visualization Lab.
Birds fly here
The El Niño atmospheric response was also apparent in March, with continued greater-than-average cloudiness and rain near the International Date Line. This is the weakened Walker Circulation pattern, due to more rising air than average over the central Pacific as the warmth of the ocean is transferred to the air above. Both the regular-flavor Southern Oscillation Index and the Equatorial Southern Oscillation Index were negative during March (-0.3 and -1.2, respectively), showing this continued atmospheric response.
We are also interested in the near-surface wind patterns, another critical component of the Walker Circulation, because these winds are how the atmosphere communicates with the ocean. The trade winds normally blow relatively steadily from east to west along the equator, keeping warm water piled up near Indonesia. When they are weaker than average, the ocean surface can warm, and the pile of warm water can begin to slosh to the east. During March, the trades were weakened, but this pattern was confined to a fairly small area of the western Pacific. (Remember this for a bit later when I get into the forecast.)
Fish swim here
El Niño’s signature warmer-than-average sea surface temperatures were solidly evident in March, with a monthly average of 0.9°C above average from ERSSTv5, our longest observation dataset. The January–March 3-month average from ERSSTv5, what we call the Oceanic Niño Index, was 0.8, marking the fifth consecutive, overlapping 3-month period above the El Niño threshold (0.5°C above average).
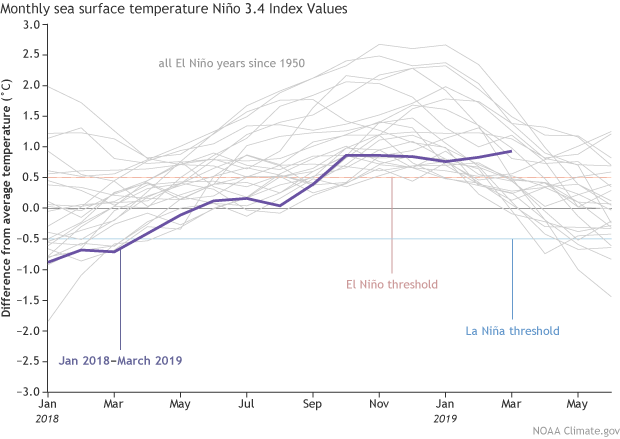
Monthly sea surface temperature in the Niño 3.4 region of the tropical Pacific for 2018–19 (purple line) and all other El Niño years since 1950. Climate.gov graph based on ERSSTv5 temperature data.
The purple line above is noticeably flat, without the gradual increase, peak, and decline that so many other El Niño events have exhibited. This flatness isn’t unusual behavior for a weak El Niño, however, as other events, including 1977–78, 1978–79, and 2004–05, show.
Future you lives here
What is unusual is the model forecast for continued weak El Niño through the summer, with the tropical Pacific sea surface temperature expected to stay a bit above the El Niño threshold. This is a pattern that we haven’t seen in the (admittedly short) 1950–present historical record.
Also, forecasters think there’s about a 50-55% probability that El Niño will continue into the fall. As we’ve discussed before, the spring predictability barrier means it’s difficult for climate models to make successful predictions during March, April, and May, a time of year when ENSO (El Niño/Southern Oscillation, the entire El Niño and La Niña system) events are usually decaying and changing phase. This springtime indecisiveness partially explains the moderate probabilities that forecasters estimate for El Niño continuing into the fall.
The amount of warmer-than-average water between the surface and about 300 meters below the surface was elevated during March, as a downwelling Kelvin wave continued to move eastward under the surface of the equatorial Pacific. As this blob of warm water gradually rises, it will provide a source of warm water to the surface, helping to keep temperatures elevated through the next few months, and helping support the forecast through the spring and summer.
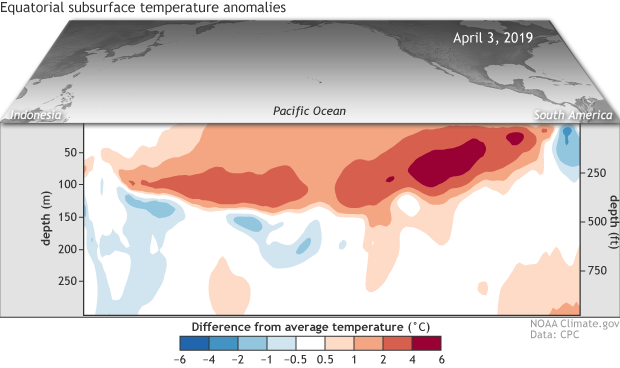
Departure from average of the surface and subsurface tropical Pacific sea temperature averaged over the 5-day period centered on April 3rd. The vertical axis is depth below the surface (meters) and the horizontal axis is longitude, from the western to eastern tropical Pacific. This cross-section is right along the equator. Climate.gov figure from CPC data.
The subsurface temperature in March, as well as the near-surface winds (see “birds” above), have some correspondence to ENSO conditions in the subsequent fall/winter, but not a super strong relationship. This 2015 post by Michelle gets into that relationship, showing that there has been a pretty wide range of outcomes in the historical record. (That post uses an older sea surface temperature dataset, but the results would be similar using the newer one.) So while these conditions are factored in to the forecast for the later part of the year, they’re not a huge source of confidence. Plus, the wind anomalies in the western Pacific are pretty darn feeble, which does not elicit comparisons with the evolution leading up to the major 2015-16 El Niño.
Since ENSO interacts with the hurricane season, I’ll be interested to see how the forecast for continued weak El Niño affects the Climate Prediction Center’s hurricane outlook, issued later next month. For now, stay tuned, and we’ll keep you updated on all things ENSO!
ENSO Blog
A blog about monitoring and forecasting El Niño, La Niña, and their impacts.
Disclaimer:
The ENSO blog is written, edited, and moderated by Michelle L’Heureux (NOAA Climate Prediction Center), Emily Becker (contractor to CPC), Nat Johnson (NOAA Geophysical Fluid Dynamics Laboratory), and Tom DiLiberto and Rebecca Lindsey (contractors to NOAA Climate Program Office), with periodic guest contributors.
Ideas and explanations found in these posts should be attributed to the ENSO blog team, and not to NOAA (the agency) itself. These are blog posts, not official agency communications; if you quote from these posts or from the comments section, you should attribute the quoted material to the blogger or commenter, not to NOAA, CPC, or Climate.gov.
Source: ENSO blog team

