


California and National Drought Summary for December 15, 2020
Summary
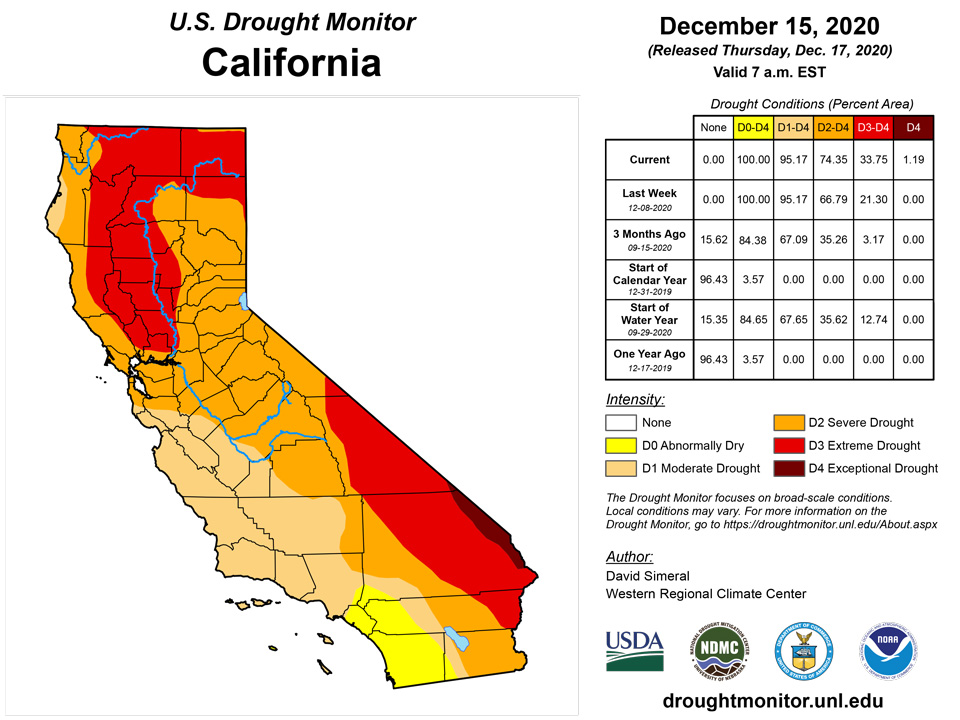
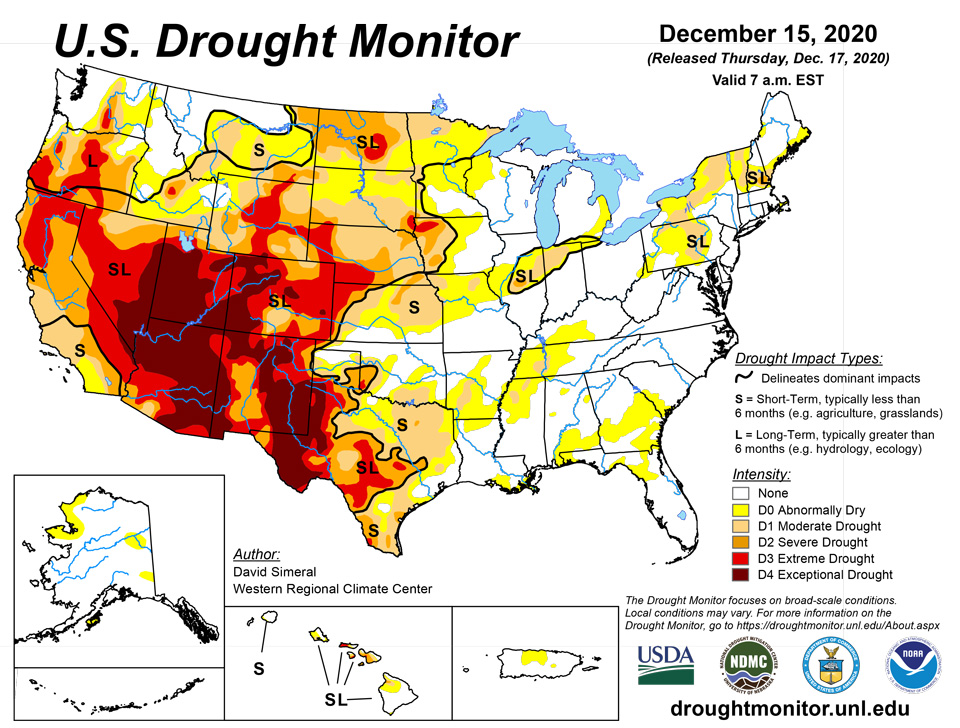
December 17, 2020 - This U.S. Drought Monitor week saw some modest improvements in drought conditions across portions of the Southwest, southern Great Plains, South, lower Midwest, and portions of the Northeast. Drought-related conditions deteriorated in southern California, the southern Great Basin, Texas, Minnesota, and parts of New England. In California, storm activity during the weekend delivered beneficial rain and snow to areas of central and northern California; however, the southern part of the state remained dry. Since January 1, areas of California—including portions of the eastern Sierra and Sacramento Valley—have received less than 25% of normal precipitation. The impact of both short- and long-term dryness in parts of California has been affecting the cattle ranching industry with numerous drought impact reports describing severe impacts to pasture and rangeland conditions as well as reports of ranchers having to sell livestock. Fortunately, another round of storms is expected to impact northern California this week bringing valley rains and mountain snows to the region. In the southern Great Basin, record dryness during the past 6-month period led to expansion of areas of Exceptional Drought (D4) in the eastern Sierra Nevada and southern Nevada. In the Southwest, both Arizona and New Mexico received light rains across parts of the lower deserts as well as some mountain snowfall in northern Arizona and northern New Mexico, providing a much-needed boost to soil moisture levels. Elsewhere, above-normal precipitation during the past 30-to-60-day period and snowfall this week in northern portions of the Texas Panhandle and Oklahoma Panhandle, led to removal of areas of drought. Further to the south in the Hill Country and South Texas Plains, drought intensified in response to persistent warm and dry conditions as well as mounting precipitation deficits ranging from 2-to-8+ inches during the past 90-day period. Conversely, areas along the coastal plains of northeastern Texas received 1-to-2+ inch accumulations during the past week leading to widespread improvements on the map. In the Midwest, wetter-than-normal conditions during the past 30-to-60-day period led to minor improvements on the map in central Illinois and northern Indiana. Likewise, portions of western New York saw improvement on the map in response to recent storm activity.
Northeast
On this week’s map, areas of the region—including the Adirondacks of New York and areas of southern Vermont—saw minor expansion of areas of Moderate Drought (D1) where precipitation has been below normal during the past 30-to-90-day period. Elsewhere, areas of Abnormally Dry (D1) were removed in western New York and across Connecticut, Rhode Island, and much of Massachusetts where recent storms have provided a needed boost to soil moisture levels and brought area streamflows to normal levels. For the week, average temperatures were above normal across the region with the greatest positive anomalies (6-to-8 deg F) observed in western Pennsylvania, northern New York, and northern portions of New Hampshire and Vermont. Overall, the region was generally dry for the past week with liquid accumulations of less than 0.5 inch. According to the National Operational Hydrologic Remote Sensing Center (NOHRSC), the regional snowpack analysis reports that 50% of the Northeast region is currently covered by snow with an average depth of 2.1 inches and a maximum depth of 17.2 inches.
Southeast
During the past week, scattered precipitation was observed across the region with rainfall accumulations ranging from 1 inch to 3+ inches in northern Alabama and northern Georgia while with areas of southern Florida receiving accumulations of ~1 inch. On the map, areas of Abnormally Dry (D0) expanded in southern Alabama and southern Georgia while new areas of D0 were introduced in the Florida Panhandle and north-central Florida where precipitation has been below normal during the past 30-to-90-day period. Average temperatures for the week were below normal across much of Florida with the greatest anomalies observed in south Florida where temperatures were 4-to-6 deg F below normal. According to the December 14 USDA National Agricultural Statistics Service (NASS) Florida Crop Progress and Condition Report, cotton producers in the Panhandle noted that cotton yields were poor this season.
During the past week, areas of the West received much needed rain and snow over the weekend with mountain snow observed in the Cascades, Sierra Nevada, ranges of central/eastern Nevada, the Uinta Mountains, and across areas of the Rockies from Montana to New Mexico. Snowfall accumulations ranged from 6-to-24+ inches in the higher elevations. In the California mountains, the current statewide soil water equivalent (SWE) for the date (Dec. 14) is 47% of normal—up 11% since last week. The current regional breakdown (percentage of normal SWE) is as follows: Northern Sierra/Trinity–46%, Central Sierra–53%, and Southern Sierra–29%. In other areas of the West, the drainage basins (6-Digit HUCs) across the Four Corners states continued to observe well below-normal SWE except for the Rio Grande Headwaters (115% of normal) and the Upper Arkansas (103% of normal) basins of Colorado. In the Pacific Northwest and northern Rockies, basins across the Cascades of Oregon/Washington as well as central/eastern Montana are near normal to above normal. On the map, areas of Severe Drought (D2) and Extreme Drought (D3) expanded in southern California where precipitation during the past 90-day period has generally been <25% of normal. These areas largely have missed recent storm events that have impacted central and northern portions of the state. In southern Nevada, areas of Exceptional Drought (D4) expanded in Clark County where McCarran International Airport (through Dec. 1) logged its driest 6-month period (June 1 to November 30) on record with only a trace of precipitation observed for the period. In Arizona, areas of Extreme Drought (D3) expanded in southwestern Arizona where Parker, Arizona along the lower Colorado River has observed no precipitation since June 1—making it the driest 6-month (June 1 to November 30) on record. Elsewhere in the state, some minor improvements were made in central Arizona and northeastern Arizona on the Navajo Nation where precipitation during the past week brought some minor improvements in soil moisture. In northern New Mexico, some minor improvements were made on the map in the Sangre de Cristo Range near Taos where soil moisture levels improved (according to NASA SPoRT) and snowfall during the past week bumped a few SNOTEL stations (Gallegos Peak, Tolby) above normal levels for the date. In southeastern Idaho, areas of Moderate Drought (D1) were reduced in response to several SNOTEL sites (Prairie, Camas Creek Divide) reporting above-normal SWE.
South
On this week’s map, areas of drought intensified and expanded in the Hill Country and South Texas Plains where warm and dry conditions continued this week. In these areas, 90-day precipitation deficits ranged from 2-to-8 inches, and current soil moisture levels were below normal according to the NASA SPoRT soil moisture monitoring products. According to Water Data for Texas (Dec. 16), monitored water supply reservoirs are currently 79.9% full—with reservoirs in the eastern half of the state ~80–90% full while reservoirs in the western half of the state were generally <40% full. In the far northern portions of the Texas Panhandle and Oklahoma Panhandle, conditions improved on the map in response to short-term precipitation including snowfall observed during the past week with accumulations ranging from 1-to-8+, according to NOAA NOHRSC. In eastern portions of Texas, northwestern Louisiana, and southeastern Oklahoma, precipitation during the past week (1-to-3 inches) led to improvements in areas of Moderate Drought (D1). Average temperatures for the week were below normal (1-to-4 deg F) in the northern Texas Panhandle, Oklahoma Panhandle, and central Oklahoma while other areas in the region were 2-to-10+ deg F above normal.
Midwest
On this week’s map, some minor changes were made including expansion of areas of Moderate Drought (D1) in northwestern Minnesota where precipitation deficits (during the past 90-day period) ranged from 2-to-4 inches. In east-central Illinois and northern Indiana, areas of Abnormally Dry (D0) were reduced in response to light precipitation during the past week as well as overall improvement in conditions during the past 30-day period. Overall, the region was generally dry during the past week except in eastern Iowa, northern Illinois, and Michigan where snowfall was observed. In northern Michigan and portions of the Upper Peninsula Michigan, snowfall accumulations ranged from 2-to-12 inches. Average temperatures for the week were above normal (2-to-10+ deg F) across the region. According to the NOAA NOHRSC (Dec. 16), 47.2% of the Northern Great Lakes region was covered by snow with an average snow depth of 1.3 inches and a maximum depth of 14.2 inches.
High Plains
On this week’s map, areas of the region—including southwestern Kansas and northeastern Wyoming—saw modest improvements including reduction in areas of Severe Drought (D2) in Wyoming and areas of Moderate Drought (D1) in southwestern Kansas where recent snowfalls have helped to improve local conditions. Average temperatures for the week were near to slightly above normal across most of the region with eastern portions of the region observing the greatest positive temperature anomalies ranging from 3-to-12 deg F above normal. According to the NOAA NOHRSC, the Upper Midwest Region was only 16.4% covered in snow (a reduction from 30.3% last month) with an average depth of 0.2 inches and a maximum depth of 30.5 inches. Field reports from the USDA NASS North Dakota Crop Progress and Condition Report (Nov. 30) yielded winter wheat conditions rated as 4% very poor, 5% poor, 50% fair, 39% good, and 2% excellent.
Alaska, Hawaii, and Puerto Rico
On this week’s map, no changes were made in Alaska or Puerto Rico. In the Hawaiian Islands, generally dry conditions prevailed across the island chain during the past week. On the map, 1-category improvements were made in areas of severe and extreme drought in the South and North Kohala districts of the Big Island where reports from the NRCS and University of Hawaii Cooperative Extension showed improvement in conditions from rainfall in late November. On Maui and Molokai, the Farm Service Agency is reporting very poor pasture conditions on the leeward side of Maui and in west Molokai. In Alaska, average temperatures for the week were above normal (2-to-9 deg F) in the Panhandle as well as areas of Southcentral, the North Slope, and eastern-central Interior while temperatures were 3-to-12 deg F below normal across portions of the Southwest, Northwest Arctic, and Aleutians. The greatest negative anomalies were observed in the Northwest Arctic. In the Northwest Arctic, Kotzebue dipped to -22° F on December 11, a -20.3° F departure from normal. According to the NRCS, SNOTEL sites in the Kenai Mountains, Chugach Range, and observing stations near Fairbanks were all reporting above-normal SWE for the date (Dec. 14). In Puerto Rico, rainfall was light (generally <1 inch) across much of the island this week with some higher totals (2-to-3 inches) observed in the northeastern corner of the island in the El Yunque National Forest.
Pacific Islands
Dry weather returned to Kapingamarangi, following 3.36 inches of desperately needed rainfall in late November and early December. Some vegetation has started to turn green with the recent rainfall, but taro patches remain brown and dry. During the ongoing drought on Kapingamarangi, many coconuts have been lost due to drought, while complete fruit losses have occurred for bananas and breadfruit. As of December 11, personnel at WSO Pohnpei reported two of six community water tanks on Kapingamarangi were full—one was filled by rainfall, while the other was filled when emergency supplies were recently delivered. Given ongoing drought impacts and lack of sustained relief, exceptional drought (D4-SL) continues across Kapingamarangi. Elsewhere in the Federated States of Micronesia, neither dryness nor drought exists. Extremely wet conditions exist on islands such as Pohnpei and Pingelap, where 5 to 7 inches of rain fell during the drought-monitoring period. Drier weather developed during the first half of December in a few areas, including the Yap Main Islands. Officially, month-to-date rainfall on Yap through the 15th totaled 2.10 inches (45% of normal). Meanwhile, drier conditions overspread the Marianas, following a very wet start to December. Saipan received 6.51 inches of rain from December 1-7, followed by just 0.18 inches from December 8-15. Wetness at Guam International Airport lingered through December 9, when 1.21 inches fell. Given earlier wetness across the Marianas, dryness is not yet a concern. A slight drying trend was also observed across portions of the Republic of the Marshall Islands. From December 8-14, rainfall totals included none (0.00 inch) on Wotje; 0.53 inch on Jaluit; and 0.97 inch on Kwajalein. Still, earlier wetness precludes the introduction of abnormal dryness, at least at the present time. Prior to this week, Wotje had experienced 10 consecutive weeks with rainfall ranging from 1.50 to 5.00 inches. In contrast, wet weather prevailed on Ailinglapalap, where 4.70 inches of rain fell during the drought-monitoring period, and Majuro. December 1-15 rainfall at Majuro totaled 7.76 inches (128% of normal). On December 15, Majuro’s reservoir storage stood at 28.642 million gallons (79.6% of the 36-million-gallon capacity)—down from an early-month peak of 32.643 million gallons. Data from Mili remains missing, as the weather observer is currently on Majuro. The Republic of Palau remained free of dryness and drought. December 1-15 rainfall at Palau International Airport totaled 7.79 inches (135% of normal), following a November sum of 9.97 inches. American Samoa continued to receive substantial rainfall. In fact, weekly rainfall (4 inches or more in some locations) was enhanced by a brush with Tropical Depression 3F (later Tropical Storm Zazu), which passed less than 200 miles southwest of Tutuila on December 12.
Virgin Islands
The dry season is underway across the U.S. Virgin Islands. Only one regularly reporting station, CoCoRaHS VI-SC-10, received more than an inch of rain during the drought-monitoring period. Most weather stations, including King Airport on St. Thomas (0.49 inch) and Rohlsen Airport on St. Croix (0.21 inch), were in the range of 0.10 to 0.50 inch. However, given earlier wetness (in November and early December), there are not yet concerns related to dryness on St. Thomas and St. John. Meanwhile, the depiction for St. Croix was changed from D0-S to D0-SL, to reflect that the Standardized Precipitation Index (SPI) is indicating abnormal dryness not only over the last few weeks, but also at time periods ranging from 6 to 12 months or more. Through December 15, year-to-date rainfall at Rohlsen Airport stood at 29.71 inches (just under 80% of normal). In fact, parts of St. Croix—including Rohlsen Airport—have been chronically dry since the historic 2017 hurricane season. Rohlsen Airport’s 2018 rainfall totaled 24.74 inches, with some missing data early in the year. In 2019, Rohlsen Airport recorded 24.72 inches, although some rainfall data was missing in January and February.
Looking Ahead
The NWS WPC 7-Day Quantitative Precipitation Forecast (QPF) calls for light-to-moderate liquid accumulations ranging from 1 to 2+ inches across portions of the South with the heaviest totals expected along the Gulf Coast of Louisiana and the Florida Panhandle. Likewise, similar accumulations are expected in the Mid-Atlantic and across southeastern portions of New England where a major winter storm is expected to impact the region starting on Wednesday with a wintry mix of rain, freezing rain, and snow. Areas from Pennsylvania to Massachusetts are expected to receive significant snowfall accumulations ranging from 6 to 20+ inches with New York City and Boston potentially receiving more than a foot of snow. Across much of the Midwest, the Plains, Texas, the Southwest, and southern portions of California and the Great Basin, dry condition are forecasted. Elsewhere in the West, a series of storms is expected to impact an area from Washington state through northern California and eastward through the northern Great Basin and central/northern Rockies. Coastal areas are expecting heavy rainfall accumulations while further inland snowfall accumulations in the higher elevations of the Cascades and northern Rockies of Idaho and northwestern Montana could see 1-to-2 feet of snow. The CPC 6–10-day Outlook calls for a moderate probability of above-normal precipitation across most of the eastern tier of the conterminous U.S., the Upper Midwest, and across much of Alaska where probabilities are higher. Elsewhere, the outlooks call for a low-to-moderate probability of below-normal precipitation across much of the conterminous U.S.—including much of the Midwest and Plains states, the Four Corners states, and California. In terms of temperature, there is a moderate-to-high probability of above-normal temperatures across nearly the entire conterminous U.S. except for the Southeast where normal temperatures are expected.
Author(s):
David Simeral, Western Regional Climate Center
Brad Rippey, U.S. Department of Agriculture
Dryness Categories
D0 Abnormally Dry—used for areas showing dryness but not yet in drought, or for areas recovering from drought.
Drought Intensity Categories
D1 Moderate Drought
D2 Severe Drought
D3 Extreme Drought
D4 Exceptional Drought
Drought or Dryness Types
S Short-Term, typically less than 6 months (e.g. agricultural, grasslands)
L Long-Term, typically greater than 6 months (e.g. hydrologic, ecologic)
Source: National Drought Mitigation Center

