


IMPORTANT NOTE: The employment data for the month of March 2022 is taken from the survey week including Mar. 12. Data for the month of April is scheduled for release on May 20, 2022.
Employers added 60,200 nonfarm payroll jobs
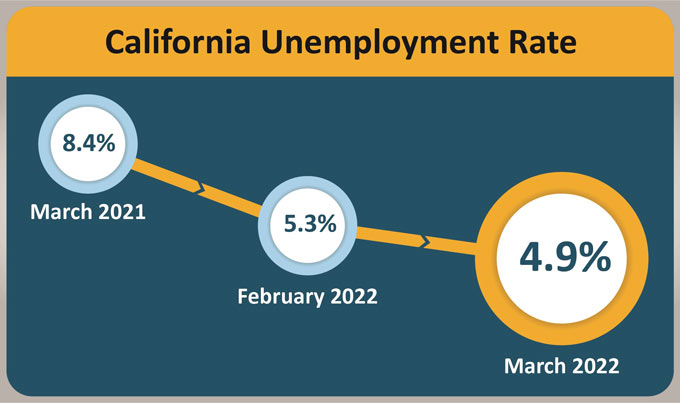
April 15, 2022 - SACRAMENTO – California’s unemployment rate went down for the month of March 2022 to 4.9 percent1 as the state’s employers added 60,200 nonfarm payroll jobs2 to the economy, according to data released today by the California Employment Development Department (EDD) from two surveys. February’s unemployment rate was revised down 0.1 percentage points to 5.3 percent due to a drop in unemployment by 12,000 persons.
California’s Labor Market, by the Numbers...
- California has now regained nearly 90 percent (2,463,400) of the 2,758,900 nonfarm jobs lost during March and April of 2020 due to the COVID-19 pandemic.
- Of the 431,000 nonfarm jobs the nation gained in March, California accounted for 14 percent of those gains, surpassing the state's 11.5 percent share of employment in the U.S.
- California has enjoyed month-over gains in nonfarm jobs in 13 of the past 14 months totaling a 1,380,100 job gain over that time period.
- Fewer than one million Californians are unemployed for the first time since Feb. 2020.
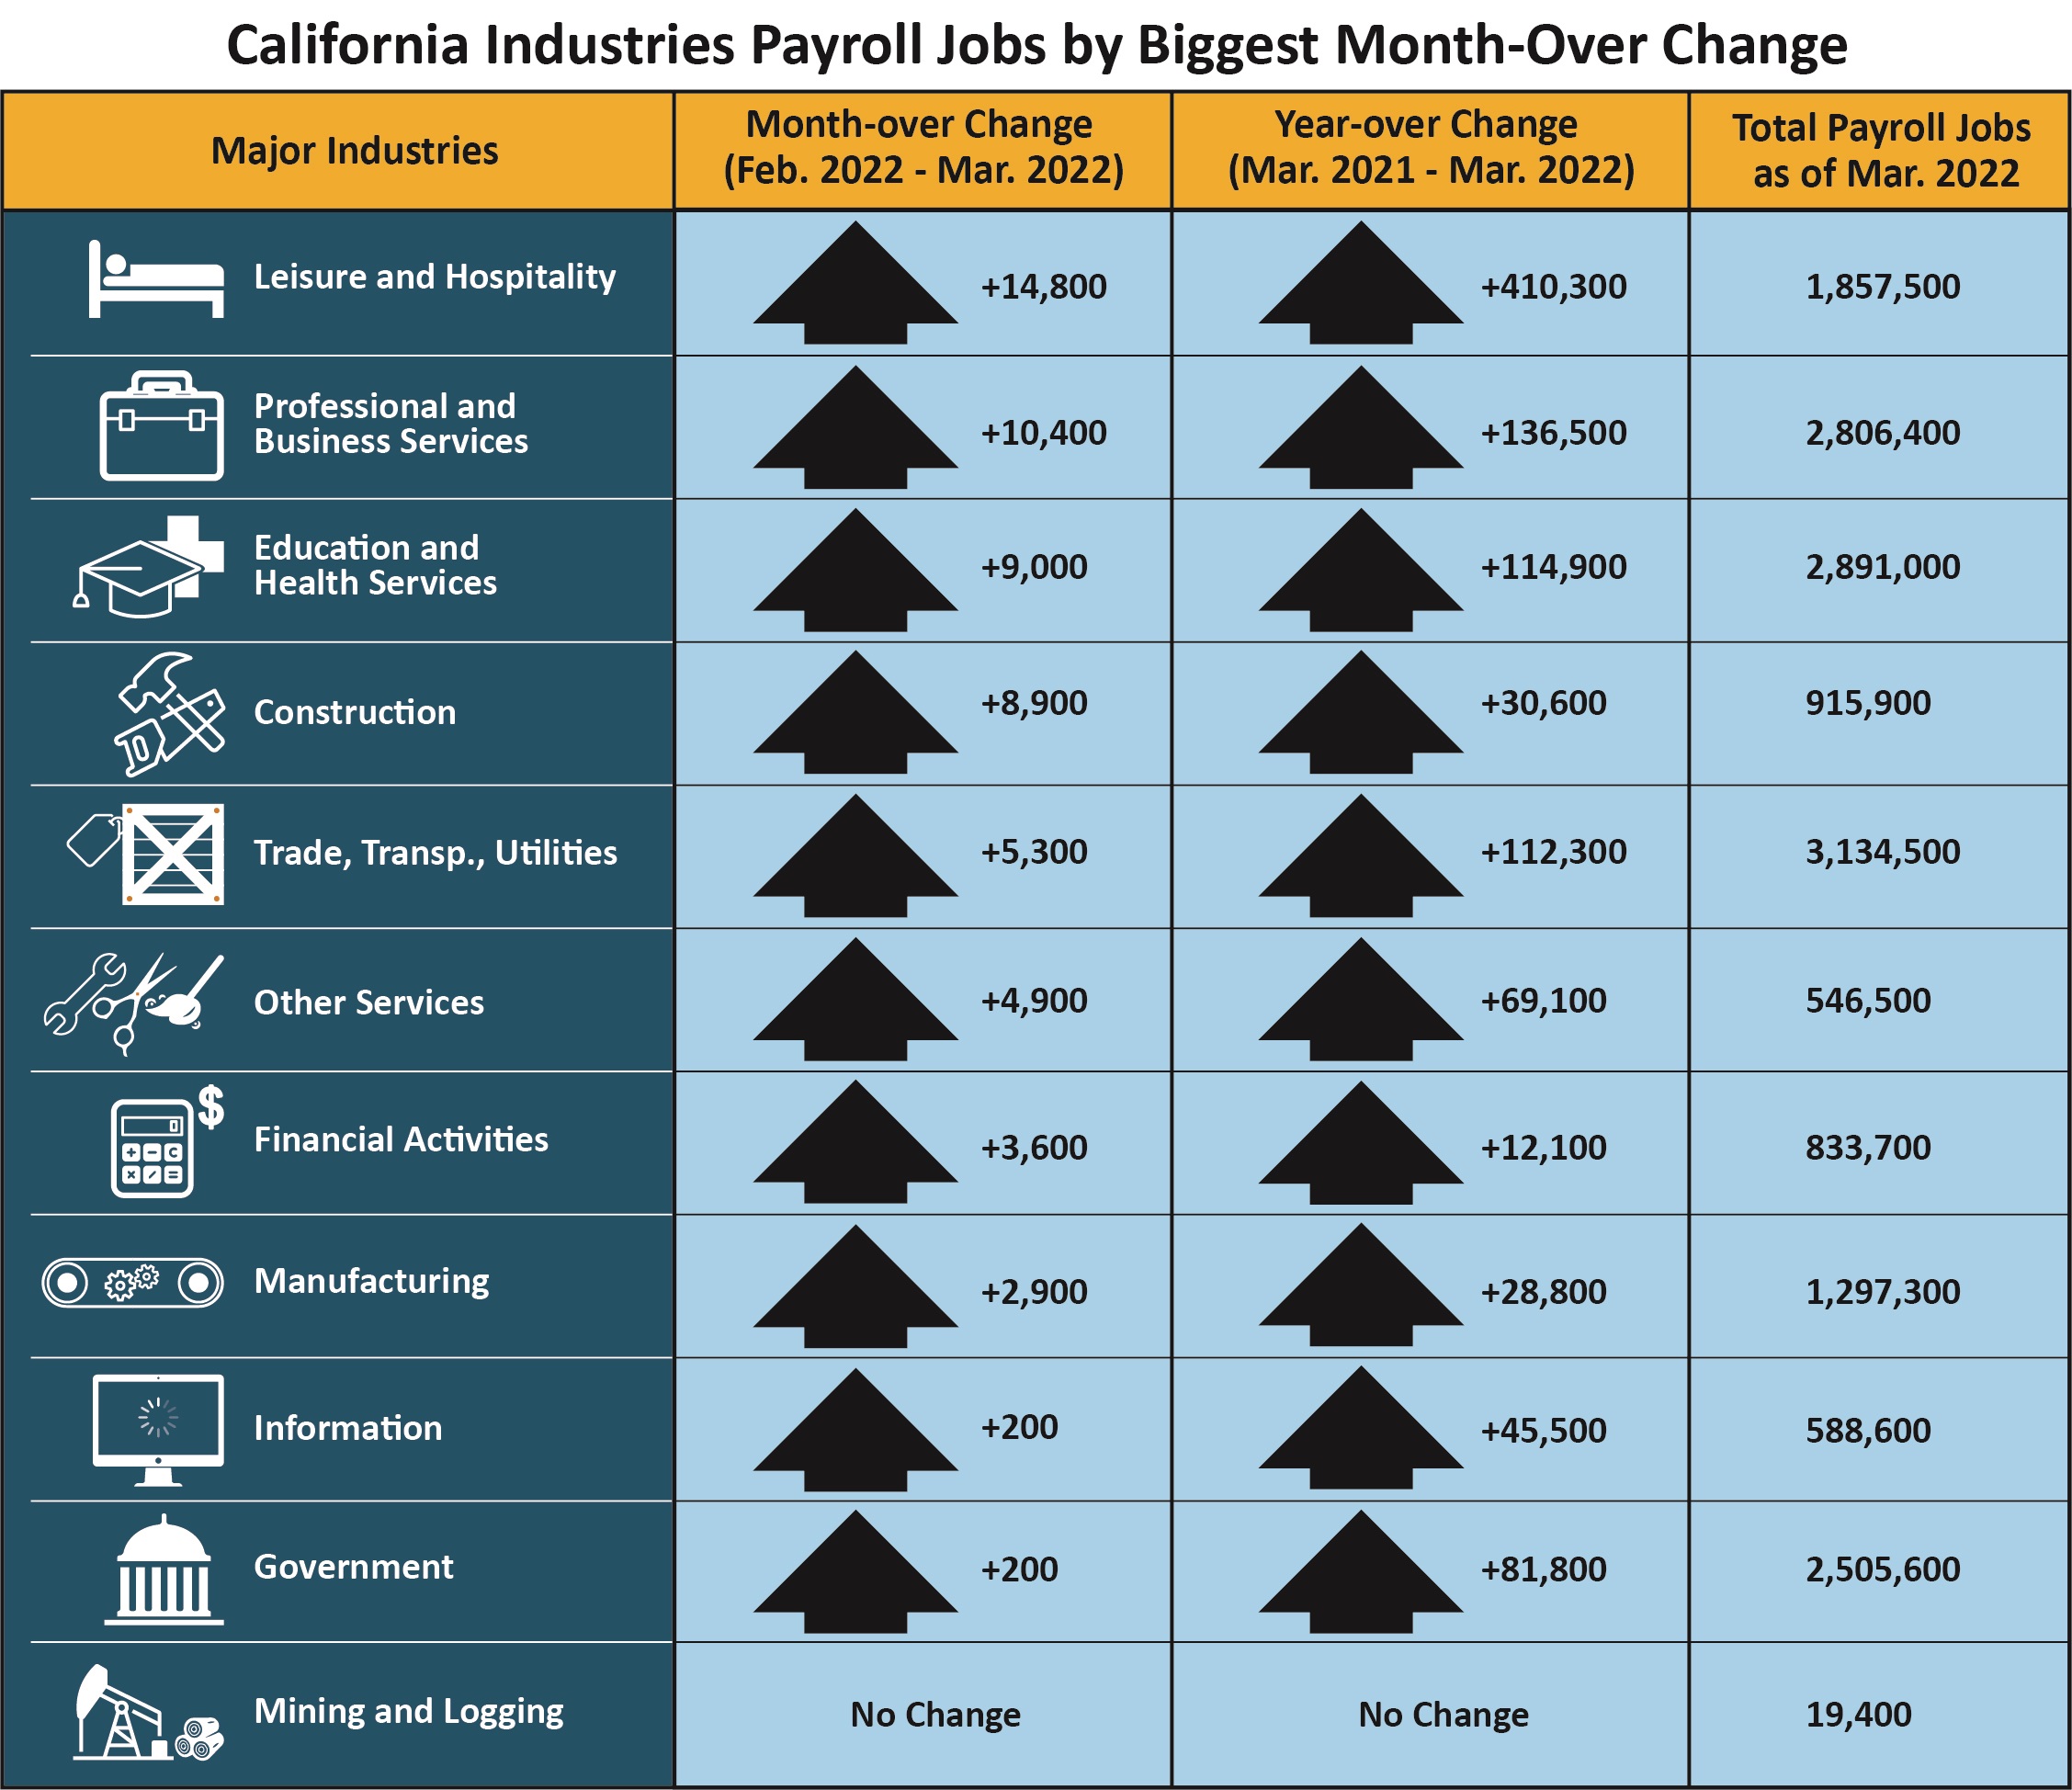
- For the second month in a row, none of California’s 11 industry sectors lost jobs and Leisure & Hospitality (+14,800) once again posted the largest job increase with Limited-Service Eating Places being its main driver.
- Professional & Business Services also posted a good-sized gain (+10,400) thanks to strength in Employment Services, as well as Accounting, Tax Preparation, and Bookkeeping Services.
1. The nonfarm payroll job numbers come from a federal survey of 80,000 California businesses.
2. The unemployment rate comes from a separate federal survey of 5,100 California households.
Data Trends about Jobs in the Economy
Total Nonfarm Payroll Jobs
This comes from a monthly survey of approximately 80,000 California businesses that estimates jobs in the economy – seasonally adjusted.
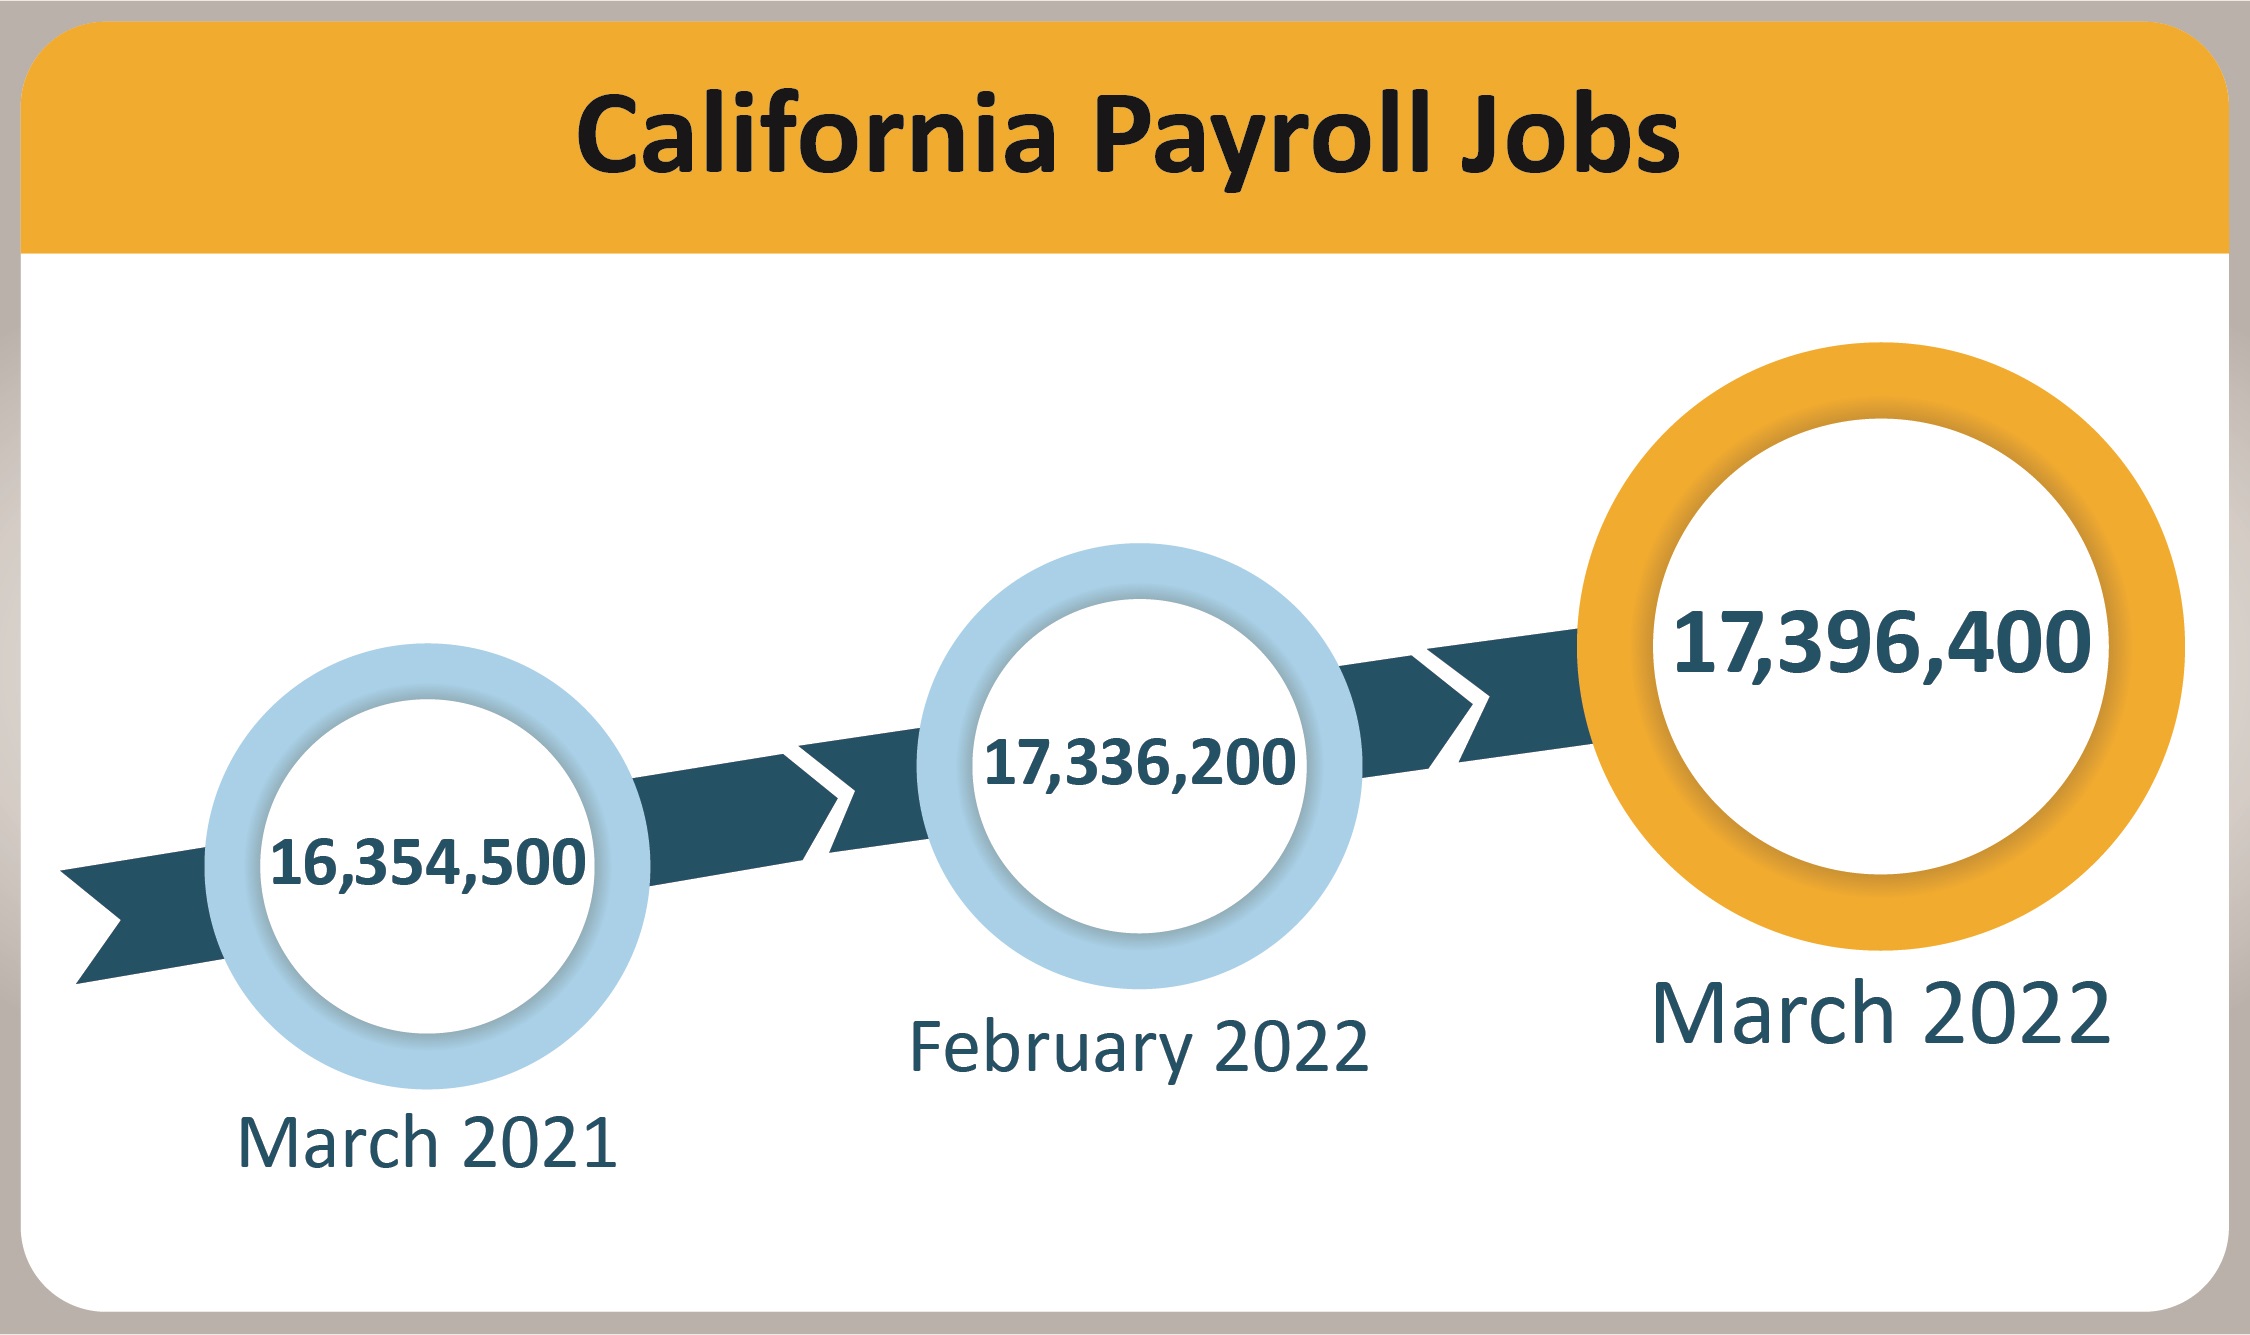
- Month-over – Total nonfarm jobs in California’s 11 major industries totaled 17,396,400 in March – a net gain of 60,200 jobs from February. This followed a downward revised (-2,700) month-over gain of 135,400 jobs in February.
- Year-over – Total nonfarm jobs increased by 1,041,900 (a 6.4 percent increase) from March 2021 to March 2022 compared to the U.S. annual gain of 6,494,000 jobs (a 4.5 percent increase).
Total Farm jobs – The number of jobs in the agriculture industry decreased by 600 from February to 413,900 jobs in March. The agricultural industry has 3,600 more farm jobs in March 2022 than it did in March a year ago.
Data Trends about Workers in the Economy
Employment and Unemployment in California
This information is based on a monthly federal survey of 5,100 California households which focuses on workers in the economy.
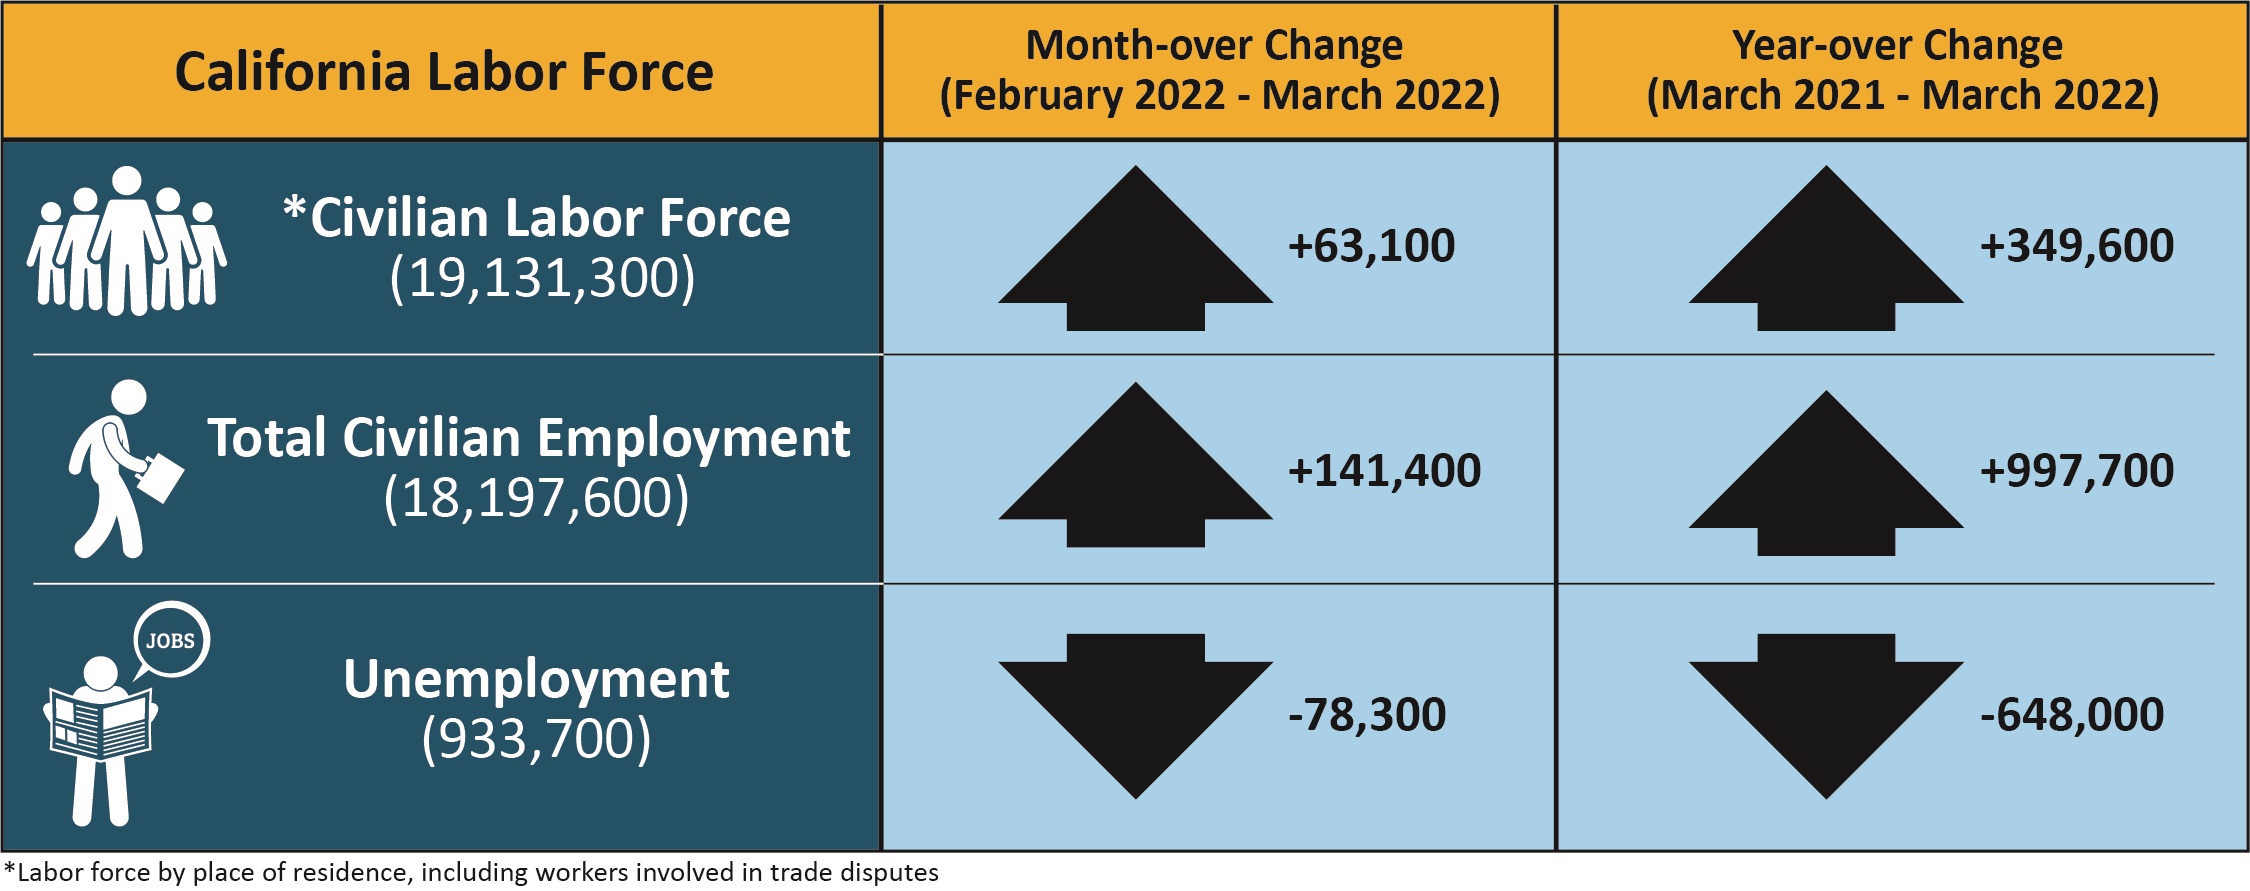
- Employed – The number of Californians employed in March was 18,197,600, an increase of 141,400 persons from February’s total of 18,056,200, and up 997,700 from the employment total in March 2021.
- Unemployed – The number of unemployed Californians was 933,700 in March, a decrease of 78,300 over the month and down 648,000 in comparison to March 2021.
Unemployment Insurance Claims (Not Seasonally Adjusted)
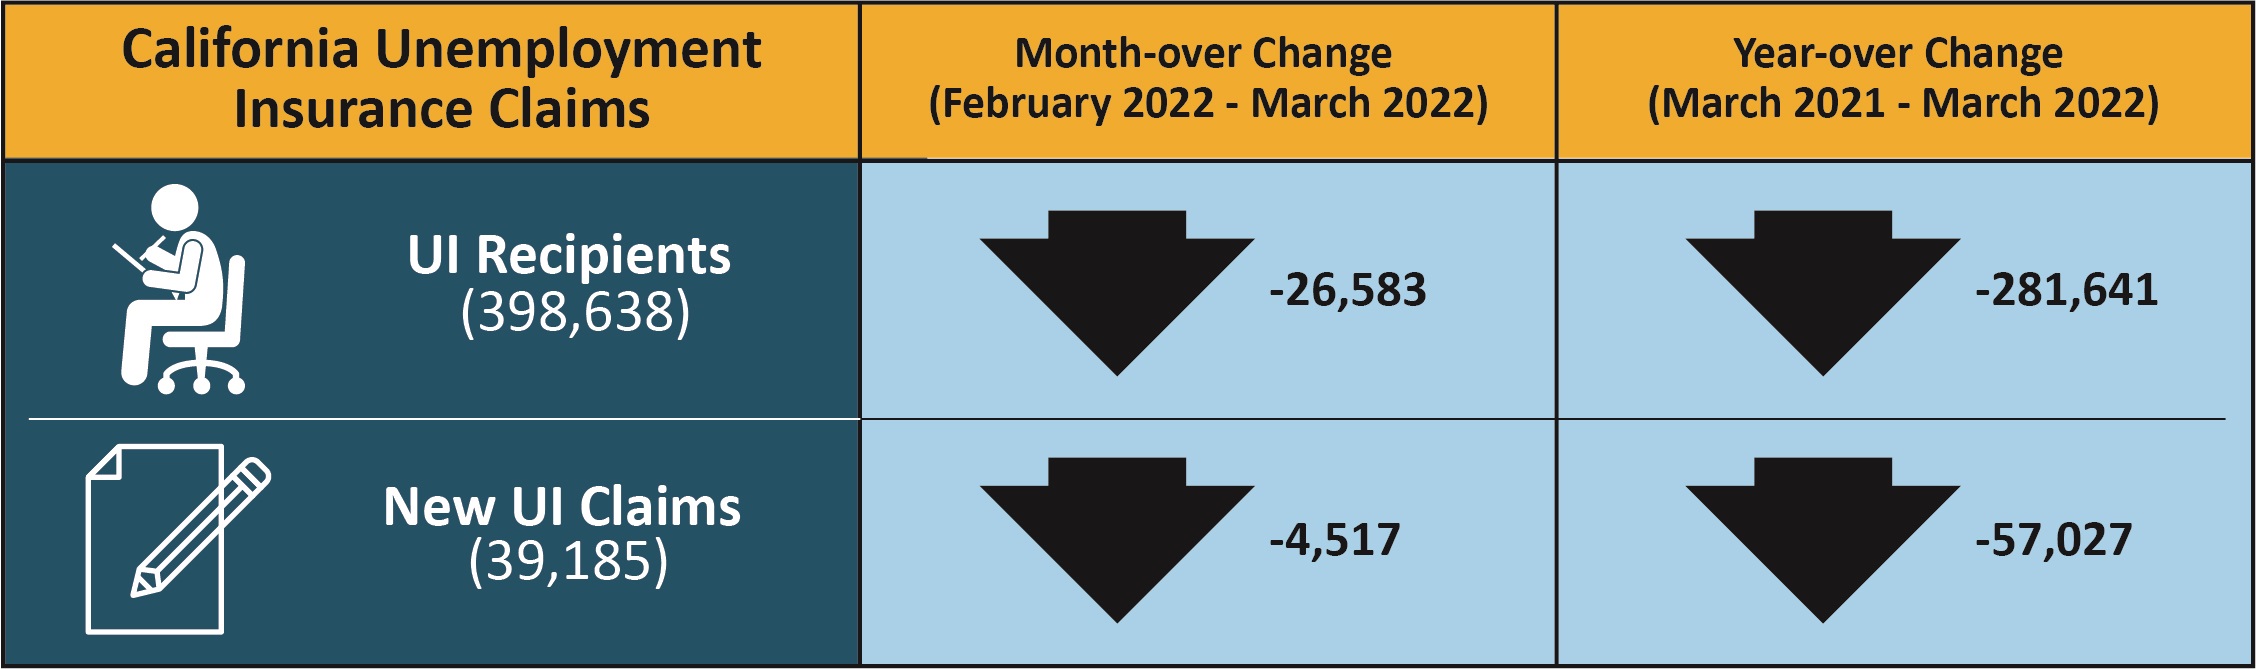
The following data is from a sample week that includes the 19th of each month: In related data that figures into the state’s unemployment rate, there were 398,638 people certifying for Unemployment Insurance benefits during the March 2022 sample week. That compares to 425,221 people in February and 680,279 people in March 2021. Concurrently, 39,185 initial claims were processed in the March 2022 sample week, which was a month-over decrease of 4,517 claims from February and a year-over decrease of 57,027 claims from March 2021.
| COUNTY | LABOR FORCE | EMPLOYMENT | UNEMPLOYMENT | RATE |
|---|---|---|---|---|
| STATE TOTAL | 19,374,100 | 18,551,100 | 823,000 | 4.2% |
| ALAMEDA | 832,800 | 805,900 | 26,800 | 3.2% |
| ALPINE | 560 | 530 | 30 | 5.3% |
| AMADOR | 14,520 | 13,860 | 660 | 4.5% |
| BUTTE | 93,000 | 88,900 | 4,100 | 4.4% |
| CALAVERAS | 21,700 | 20,940 | 770 | 3.5% |
| COLUSA | 10,850 | 9,490 | 1,350 | 12.5% |
| CONTRA COSTA | 556,700 | 537,400 | 19,300 | 3.5% |
| DEL NORTE | 9,390 | 8,920 | 480 | 5.1% |
| EL DORADO | 93,900 | 90,800 | 3,100 | 3.3% |
| FRESNO | 453,900 | 422,800 | 31,100 | 6.9% |
| GLENN | 12,690 | 12,050 | 640 | 5.0% |
| HUMBOLDT | 59,900 | 57,800 | 2,200 | 3.7% |
| IMPERIAL | 70,300 | 61,600 | 8,700 | 12.3% |
| INYO | 8,310 | 8,010 | 300 | 3.6% |
| KERN | 380,100 | 351,000 | 29,200 | 7.7% |
| KINGS | 56,600 | 52,400 | 4,300 | 7.5% |
| LAKE | 28,790 | 27,340 | 1,450 | 5.0% |
| LASSEN | 8,840 | 8,440 | 400 | 4.5% |
| LOS ANGELES | 5,072,300 | 4,824,600 | 247,700 | 4.9% |
| MADERA | 63,600 | 59,500 | 4,100 | 6.4% |
| MARIN | 132,000 | 128,800 | 3,100 | 2.4% |
| MARIPOSA | 6,360 | 6,000 | 360 | 5.7% |
| MENDOCINO | 37,600 | 36,150 | 1,460 | 3.9% |
| MERCED | 116,800 | 107,100 | 9,700 | 8.3% |
| MODOC | 3,170 | 2,980 | 190 | 5.9% |
| MONO | 9,550 | 9,200 | 350 | 3.6% |
| MONTEREY | 207,700 | 191,900 | 15,800 | 7.6% |
| NAPA | 70,100 | 67,900 | 2,300 | 3.2% |
| NEVADA | 48,120 | 46,510 | 1,600 | 3.3% |
| ORANGE | 1,597,500 | 1,547,700 | 49,800 | 3.1% |
| PLACER | 194,400 | 189,000 | 5,400 | 2.8% |
| PLUMAS | 6,980 | 6,380 | 600 | 8.6% |
| RIVERSIDE | 1,165,800 | 1,116,200 | 49,600 | 4.3% |
| SACRAMENTO | 732,300 | 702,900 | 29,400 | 4.0% |
| SAN BENITO | 32,700 | 31,000 | 1,700 | 5.3% |
| SAN BERNARDINO | 1,020,200 | 976,200 | 44,100 | 4.3% |
| SAN DIEGO | 1,596,800 | 1,542,100 | 54,700 | 3.4% |
| SAN FRANCISCO | 572,100 | 557,600 | 14,500 | 2.5% |
| SAN JOAQUIN | 339,200 | 319,900 | 19,200 | 5.7% |
| SAN LUIS OBISPO | 139,000 | 135,100 | 3,900 | 2.8% |
| SAN MATEO | 452,600 | 442,200 | 10,400 | 2.3% |
| SANTA BARBARA | 221,700 | 213,900 | 7,800 | 3.5% |
| SANTA CLARA | 1,047,800 | 1,022,100 | 25,700 | 2.5% |
| SANTA CRUZ | 134,700 | 127,600 | 7,100 | 5.2% |
| SHASTA | 74,100 | 70,700 | 3,400 | 4.6% |
| SIERRA | 1,320 | 1,260 | 60 | 4.8% |
| SISKIYOU | 16,070 | 15,030 | 1,040 | 6.5% |
| SOLANO | 202,600 | 193,300 | 9,200 | 4.6% |
| SONOMA | 249,100 | 241,700 | 7,400 | 3.0% |
| STANISLAUS | 241,900 | 228,200 | 13,700 | 5.7% |
| SUTTER | 45,900 | 42,700 | 3,200 | 7.0% |
| TEHAMA | 25,340 | 24,130 | 1,210 | 4.8% |
| TRINITY | 4,320 | 4,120 | 200 | 4.7% |
| TULARE | 203,600 | 186,500 | 17,100 | 8.4% |
| TUOLUMNE | 20,010 | 19,080 | 930 | 4.7% |
| VENTURA | 414,700 | 400,300 | 14,400 | 3.5% |
| YOLO | 109,500 | 105,500 | 4,100 | 3.7% |
| YUBA | 31,500 | 29,700 | 1,800 | 5.7% |
Source: EDD

