


IMPORTANT NOTE: The employment data for the month of March 2024 is taken from the survey week including Mar. 12. Data for April is scheduled for release on May 17, 2024.
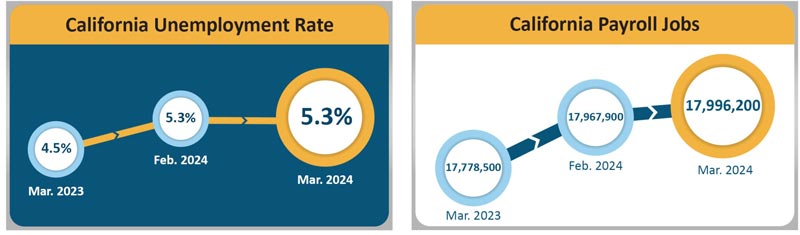
April 19, 2024 - SACRAMENTO – California’s employers added 28,300 nonfarm payroll jobs1 in March 2024 and the unemployment rate held steady at 5.3 percent2, according to data released today by the Employment Development Department (EDD) from two surveys. Despite the mostly weather-related job loss of 6,600 in February (revised down by 3,200), March continued a job growth trend over the last eight months that totals 205,200 jobs – a monthly average increase of 25,700 jobs.
California's Labor Market, by the Numbers...
- The State’s job market expansion is now 47 months long. Since April 2020, California has gained 3,062,700 jobs, or about 65,200 per month on average.
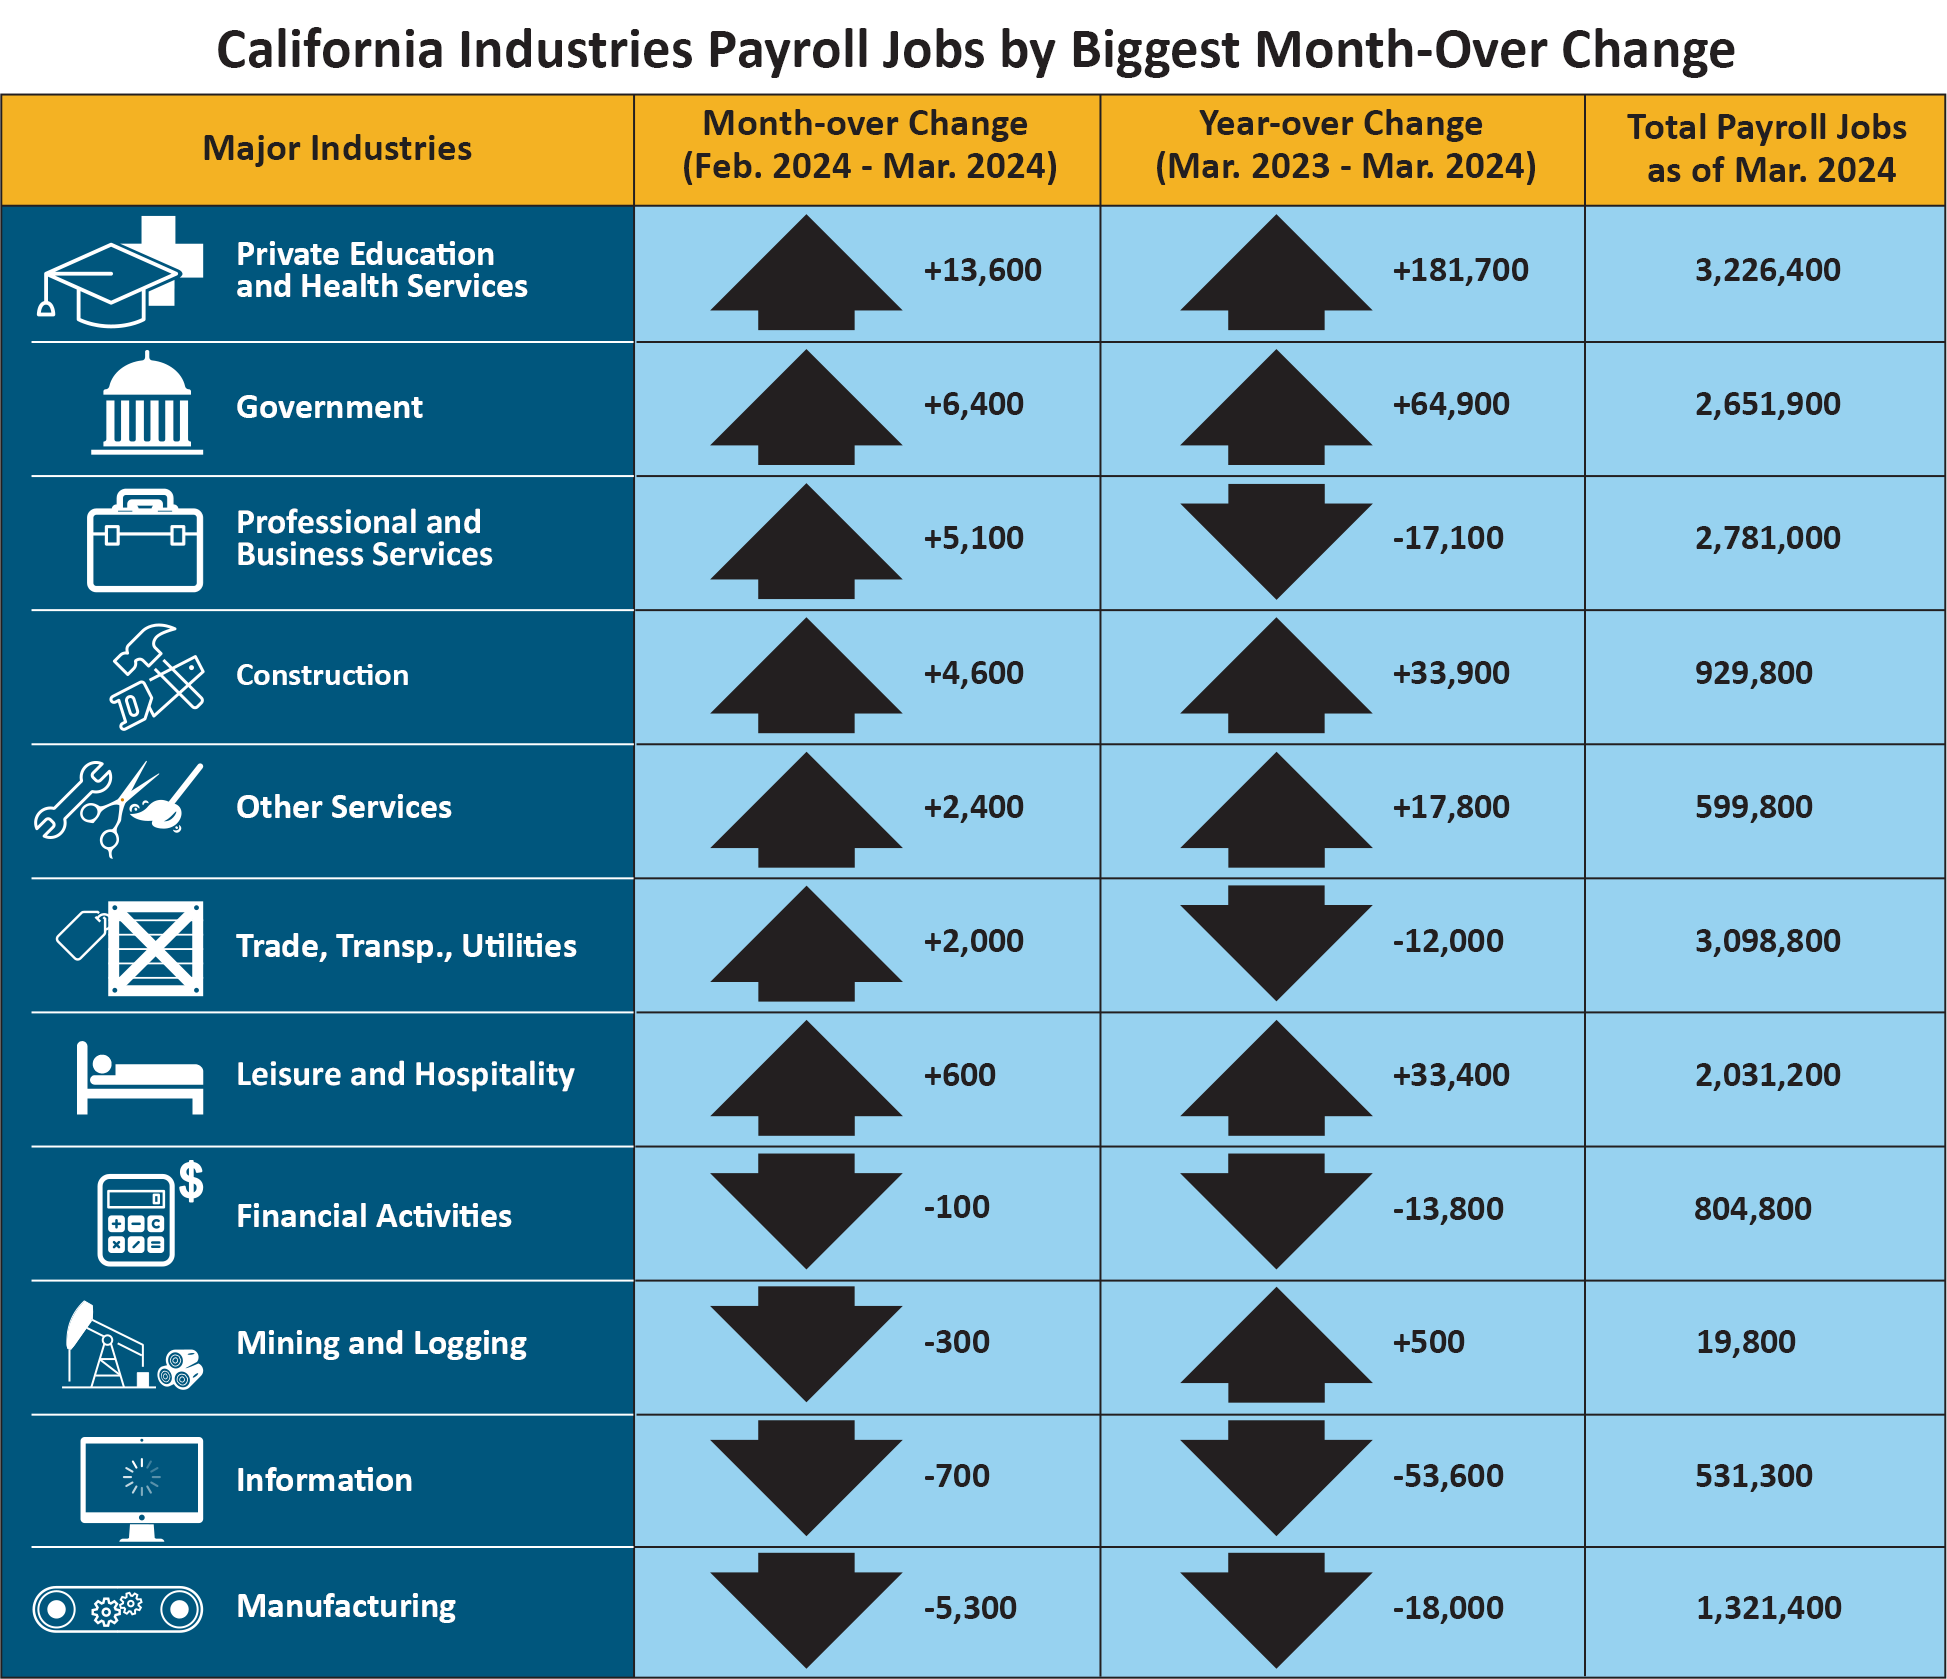
- Seven of California's 11 industry sectors gained jobs in March with Private Education & Health Services (+13,600) posting the largest month-over gain for the third month in a row. This was due in part to payroll additions in Social Assistance, which saw noticeable growth with in-home support service workers.
- Construction bounced back after a weather-related decrease last month with a gain of 4,600 jobs. The industry is up 33,900 jobs over the year.
- Manufacturing (-5,300) experienced the largest month-over job reduction with losses in sectors including Machinery Manufacturing and Food Manufacturing.
- California’s latest unemployment rate is in line with the 5% average rate over five years leading into the pandemic – during one of the longest economic expansions in state history.
1. The unemployment rate comes from a separate federal survey of 5,100 California households.
2. The nonfarm payroll job numbers come from a federal survey of 80,000 California businesses.
Data Trends about Jobs in the Economy
Total Nonfarm Payroll Jobs
Total Nonfarm Payroll Jobs (Comes from a monthly survey of approximately 80,000 California businesses that estimates jobs in the economy – seasonally adjusted)
- Month-over – Total nonfarm jobs in California’s 11 major industries amounted to 17,996,200 in March – a net gain of 28,300 from February. This followed a downward revised (-3,200) month-over loss of 6,600 jobs in February.
- Year-over – Total nonfarm jobs increased by 217,700 (a 1.2 percent increase) from March 2023 to March 2024 compared to the U.S. annual gain of 2,927,000 jobs (a 1.9 percent increase).
Total Farm Jobs – While the number of jobs in the agriculture industry decreased by 2,000 jobs from February to a total of 423,000 jobs in March, the agriculture industry did have 31,300 more farm jobs in March 2024 than it did in March a year ago.
Data Trends about Workers in the Economy
Employment and Unemployment in California (Based on a monthly federal survey of 5,100 California households which focuses on workers in the economy)
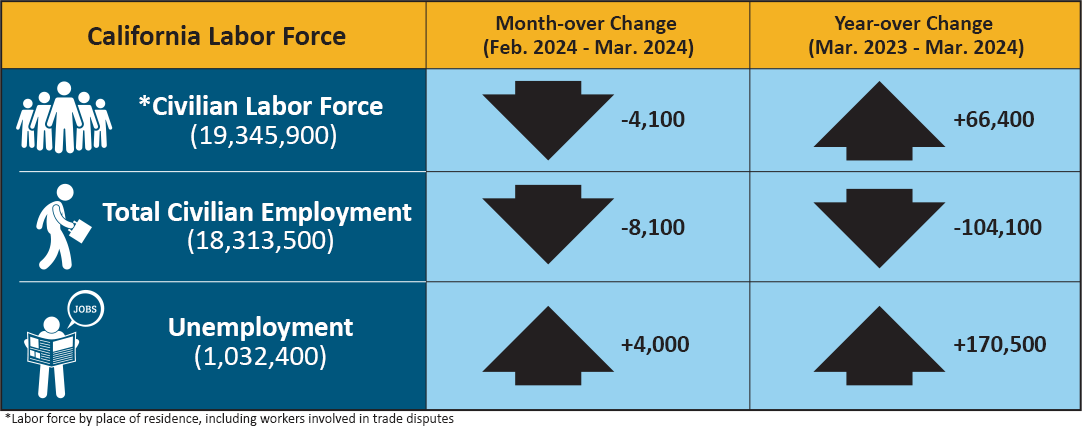
- Employed – The number of Californians employed in March was 18,313,500, a small decrease of 8,100 persons from February’s total of 18,321,600 and down 104,100 from the employment total in March 2023.
- Unemployed – The number of unemployed Californians was 1,032,400 in March, an increase of 4,000 over the month and up 170,500 in comparison to March 2023.
Unemployment Insurance Claims (Not Seasonally Adjusted)
The following data is from a sample week that includes the 19th of each month:
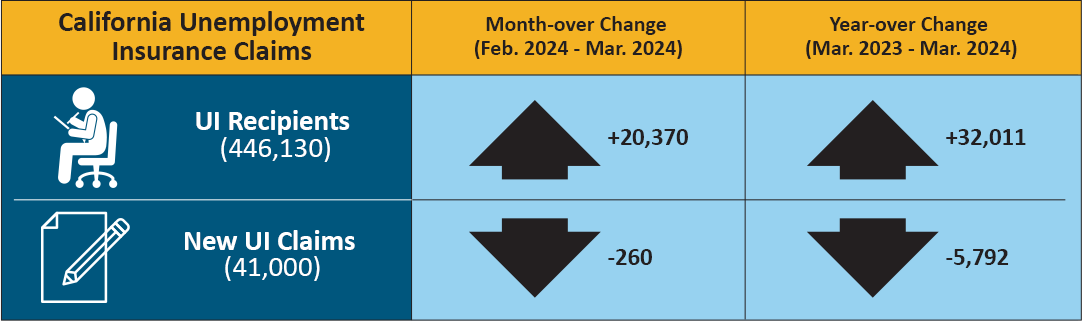
A total of 41,000 initial claims for unemployment were processed in the March 2024 sample week, which was a month-over decrease of 260 claims from February and a year-over decrease of 5,792 claims from March 2023. In related data that figures into the state’s unemployment rate, there were 446,130 people certifying for Unemployment Insurance (UI) benefits during the March 2024 sample week. That compares to 425,760 people in February and 414,119 people in March 2023.
| COUNTY | LABOR FORCE | EMPLOYMENT | UNEMPLOYMENT | RATE |
|---|---|---|---|---|
| STATE TOTAL | 19,409,300 | 18,372,600 | 1,036,700 | 5.3% |
| ALAMEDA | 828,200 | 789,800 | 38,400 | 4.6% |
| ALPINE | 640 | 600 | 40 | 6.0% |
| AMADOR | 14,730 | 13,900 | 830 | 5.6% |
| BUTTE | 93,700 | 87,700 | 6,000 | 6.4% |
| CALAVERAS | 22,310 | 21,160 | 1,150 | 5.2% |
| COLUSA | 11,030 | 8,920 | 2,120 | 19.2% |
| CONTRA COSTA | 553,200 | 527,200 | 26,000 | 4.7% |
| DEL NORTE | 9,320 | 8,740 | 590 | 6.3% |
| EL DORADO | 95,700 | 91,200 | 4,500 | 4.7% |
| FRESNO | 467,000 | 424,300 | 42,600 | 9.1% |
| GLENN | 12,770 | 11,800 | 970 | 7.6% |
| HUMBOLDT | 61,300 | 58,000 | 3,300 | 5.4% |
| IMPERIAL | 72,900 | 61,200 | 11,800 | 16.1% |
| INYO | 8,540 | 8,180 | 370 | 4.3% |
| KERN | 391,700 | 352,000 | 39,700 | 10.1% |
| KINGS | 59,700 | 53,700 | 6,000 | 10.0% |
| LAKE | 29,170 | 27,240 | 1,930 | 6.6% |
| LASSEN | 8,610 | 8,000 | 610 | 7.1% |
| LOS ANGELES | 5,029,800 | 4,767,300 | 262,500 | 5.2% |
| MADERA | 66,300 | 60,400 | 5,900 | 8.9% |
| MARIN | 133,300 | 128,400 | 4,900 | 3.7% |
| MARIPOSA | 7,420 | 6,940 | 470 | 6.4% |
| MENDOCINO | 38,150 | 35,970 | 2,180 | 5.7% |
| MERCED | 121,700 | 107,700 | 14,100 | 11.5% |
| MODOC | 3,220 | 2,940 | 290 | 8.9% |
| MONO | 9,370 | 8,990 | 380 | 4.0% |
| MONTEREY | 215,300 | 192,800 | 22,500 | 10.5% |
| NAPA | 72,600 | 69,600 | 3,000 | 4.2% |
| NEVADA | 49,730 | 47,470 | 2,260 | 4.5% |
| ORANGE | 1,599,900 | 1,537,100 | 62,800 | 3.9% |
| PLACER | 198,100 | 189,600 | 8,500 | 4.3% |
| PLUMAS | 7,300 | 6,450 | 850 | 11.6% |
| RIVERSIDE | 1,164,300 | 1,104,200 | 60,100 | 5.2% |
| SACRAMENTO | 742,500 | 706,000 | 36,500 | 4.9% |
| SAN BENITO | 32,600 | 30,200 | 2,500 | 7.5% |
| SAN BERNARDINO | 1,018,800 | 967,100 | 51,700 | 5.1% |
| SAN DIEGO | 1,603,100 | 1,532,300 | 70,800 | 4.4% |
| SAN FRANCISCO | 559,400 | 538,800 | 20,600 | 3.7% |
| SAN JOAQUIN | 350,100 | 325,100 | 25,000 | 7.1% |
| SAN LUIS OBISPO | 137,200 | 131,800 | 5,400 | 4.0% |
| SAN MATEO | 442,900 | 427,600 | 15,300 | 3.5% |
| SANTA BARBARA | 218,900 | 207,900 | 11,100 | 5.1% |
| SANTA CLARA | 1,037,600 | 995,400 | 42,200 | 4.1% |
| SANTA CRUZ | 133,800 | 123,800 | 10,000 | 7.4% |
| SHASTA | 75,100 | 70,400 | 4,700 | 6.3% |
| SIERRA | 1,330 | 1,230 | 100 | 7.5% |
| SISKIYOU | 16,660 | 15,280 | 1,380 | 8.3% |
| SOLANO | 205,300 | 194,400 | 10,900 | 5.3% |
| SONOMA | 251,200 | 240,800 | 10,400 | 4.2% |
| STANISLAUS | 250,300 | 231,700 | 18,600 | 7.4% |
| SUTTER | 47,800 | 43,100 | 4,700 | 9.8% |
| TEHAMA | 26,450 | 24,630 | 1,820 | 6.9% |
| TRINITY | 4,620 | 4,290 | 330 | 7.1% |
| TULARE | 213,700 | 188,100 | 25,500 | 12.0% |
| TUOLUMNE | 20,360 | 19,200 | 1,170 | 5.7% |
| VENTURA | 417,900 | 398,600 | 19,300 | 4.6% |
| YOLO | 111,800 | 105,300 | 6,500 | 5.8% |
| YUBA | 32,900 | 30,200 | 2,700 | 8.1% |
Source: EDD

